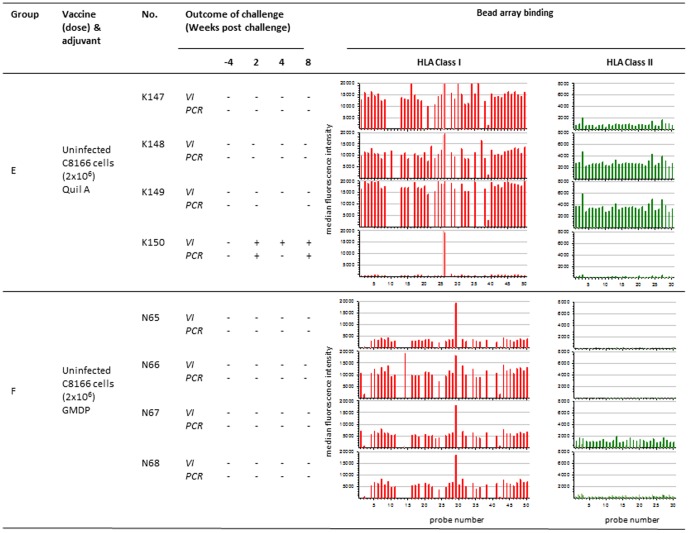
Figure 3. Association between anti-HLA reactivity following vaccination with uninfected C8166 cells using different adjuvants and outcome of challenge.
Virus infection status was determined by PCR for SIVgag proviral DNA and virus isolation (VI) from PBMC of macaques challenged with SIVmac25132H (a) following vaccination with 4 doses of uninfected C8166 cells with Quil A adjuvant (group E) or with GMDP adjuvant (group F) (a) following vaccination with 2 doses of SIV infected C8166 cells (group C) or with uninfected C8166 cells (group D). Bar charts show the associated median fluorescence intensity (y axis) of serum samples for each macaque tested against HLA class I (red bars) and class II (green bars) bead sets (x axis). Background binding of pre-vaccination sera is shown as light red and light green for HLA class I and class II respectively. * indicates not tested, probe number refers HLA allele-specific bead sets.

