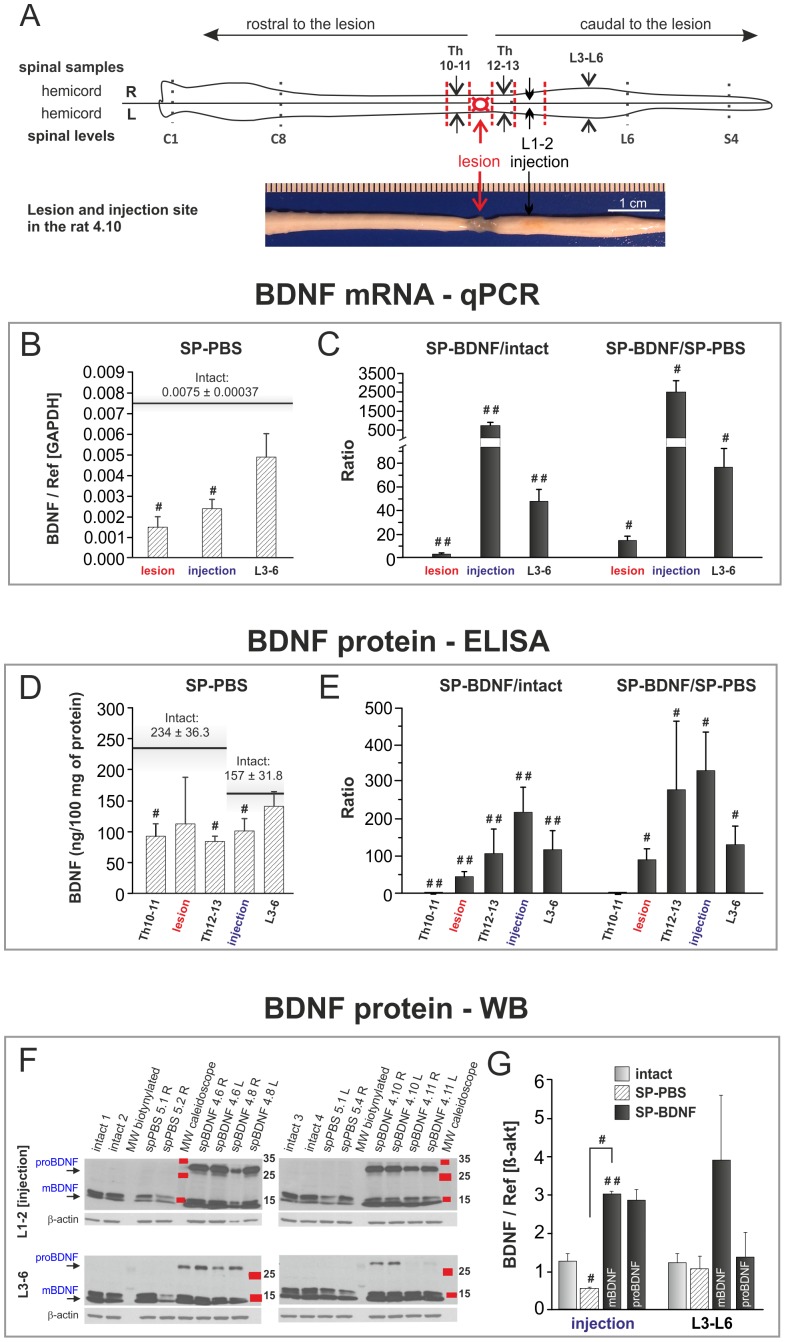
Figure 2. AAV-BDNF counteracts thoraco-lumbar BDNF deficits and causes BDNF overproduction in spinal segments 7 weeks after spinal cord transection.
(A) Diagrammatic representation of spinal cord microdissection for biochemical analyses. A photograph exemplifying the lesion and injection site is shown below. AAV-BDNF was injected separately to each hemicord, and injection efficacy was analyzed for samples from right (R) and left (L) hemicords, except for the lesioned Th11–12 segment. Afterwards, the means from L and R hemicords were calculated and presented in the B–G. BDNF mRNA levels were evaluated with qPCR (B, C). BDNF concentration was measured with ELISA in the s1 fraction obtained from the homogenates of spinal Th10-L6 segments (D, E), and changes in BDNF mature (mBDNF) and precursor (proBDNF) forms were evaluated by Western blot analysis (F, G). Spinal cord transection leads to a decrease in the BDNF mRNA level (B; hatched bars) and protein concentration (D; hatched bars) in the lesion site, low thoracic and rostral lumbar segments. Black horizontal lines in B and D mark the control values for the intact animals. AAV-BDNF causes significant increase of the level of BDNF transcript (C; black bars) and BDNF concentration (E; black bars) in the transection site and in the spinal segments caudally to the transection. Bars in C and E show the ratios of the means of BDNF mRNA (C) and protein (E) concentration in spinal BDNF-treated rats (SP-BDNF) to that in the intact animals (left panels) and in SP-PBS rats (right panels). (F) Representative Western blots show the occurrence of mBDNF in individual intact, SP-PBS and SP-BDNF rats and indicate, that proBDNF is clearly detectable in SP-BDNF rats; in the intact and SP-PBS rats proBDNF is below the level of detection. (G) Relative optical density of mBDNF bands in respective groups indicate that in SP-BDNF rats mBDNF is elevated above controls in the rostral lumbar segment and tends to increase in the caudal lumbar segments (P = 0.061); 2 to 4 Western blot performed for each sample were analyzed and data were normalized to β-actin. Bars represent means±SD (B–E) or ± SEM (G) from 5 intact, 3 SP-PBS and 4 SP-BDNF rats. Mann-Whitney U test, #P<0.05, ##P<0.01.

