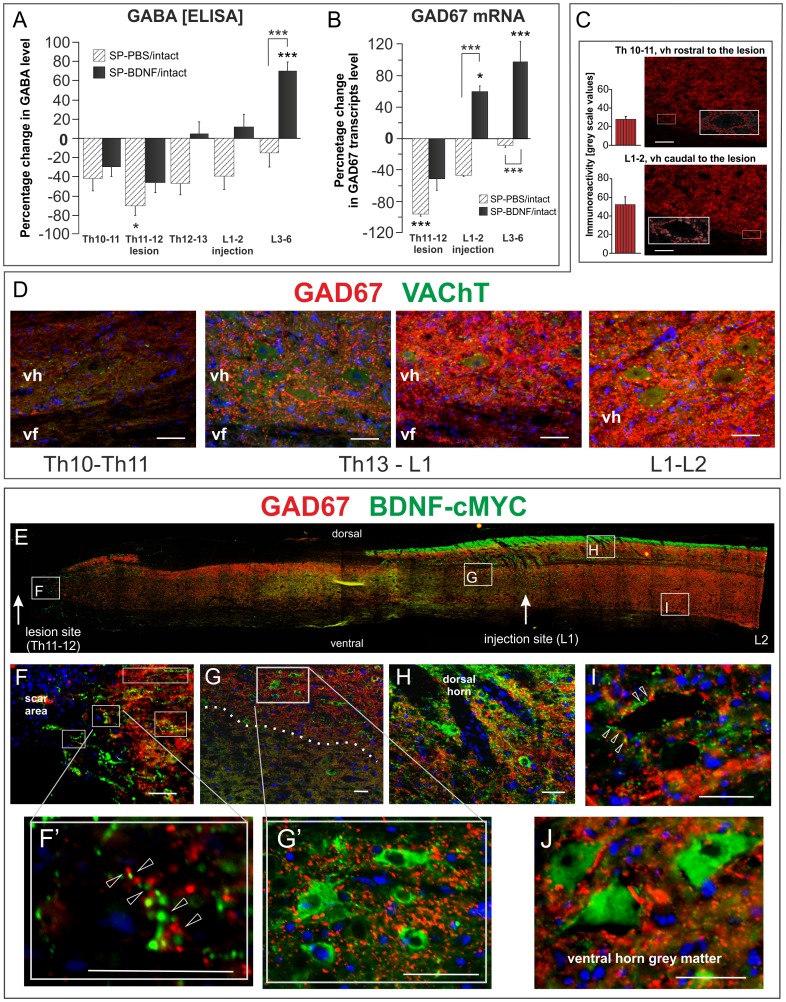
Figure 6. AAV-BDNF-induced segmental changes of GABA and GAD67 mRNA 7 weeks after spinal cord transection.
(A, B) BDNF overexpression leads to an increase of GABA and GAD67 mRNA levels exceeding control levels in L3–6 segments. Hatched and black bars represent their segmental levels in SP-PBS and SP-BDNF rats, respectively, expressed as a percentage of the level in intact animals. GABA concentration in intact rats equals to 2.38±0.16 µmol/100mg of protein. Asterisks above the bars indicate significant differences between spinalized rats and intact controls; asterisks above the square brackets indicate significant differences between the SP-PBS and SP-BDNF groups. Data are the means ± SEM from 5 intact, 3 SP-PBS and 4 SP-BDNF rats. Two-way ANOVA with Tukey post-hoc tests were used, *P<0.05, ***P<0.001. (C) Labeling intensity of GAD67-positive boutons terminating on large neurons of the ventral horn (insets) is lower in Th10–11 than in L1–2 segments (means ± SD measured in 26 and 29 boutons, respectively). An example. (D) GAD67-immunolabeling of fibers and boutons (red) terminating on motoneurons (immunolabeled for VAChT, green) in the longitudinal parasagittal section of the spinal cord of the rat that received BDNF transgene with cMYC tag. Note a gradient of GAD67 immunolabeling intensity, which is lower in the thoracic region above the transection site (Th10–11, devoid of BDNF-cMYC expression - left), than in the lumbar (L1–2) region, enriched in BDNF-cMYC. Abbreviations: vh – ventral horn, vf – ventral funiculus. Bars equal to 50 µm. (E) A reconstruction from fused microphotographs of a thoraco-lumbar longitudinal parasagittal section of the spinal cord from the SP-BDNF rat shows widespread distribution of BDNF-cMYC immunostaining (green) caudally to the lesion. Framed areas on E (showed in higher magnification in F–I) demonstrate that BDNF transgen expression spatially correlates with GAD67 labeling (red). BDNF-cMYC is present in fibers (arrowheads), some with varicosities (F, F’, H, I) and in neuronal perikarya throughout grey matter (G, G’, H, J). Except for the scar area devoid of GAD67 immunolabeling (F), in other regions BDNF-cMYC signal is associated with intense GAD67 immunoreactivity detected in cell perikarya and fibers (the area above the dashed line in G and the dorsal horn region in H). No co-localization of the two markers was observed; arrowheads indicate separate cMYC and GAD67 signals in fibers (F’) including boutons apposing large BDNF-cMYC negative neurons (I). BDNF-cMYC positive neurons are GAD67 negative and receive no inputs from BDNF-cMYC expressing projections (G, G’, H, J). Hoechst labeling (in blue) marks cell nuclei. Bars equal to 50 µm.

