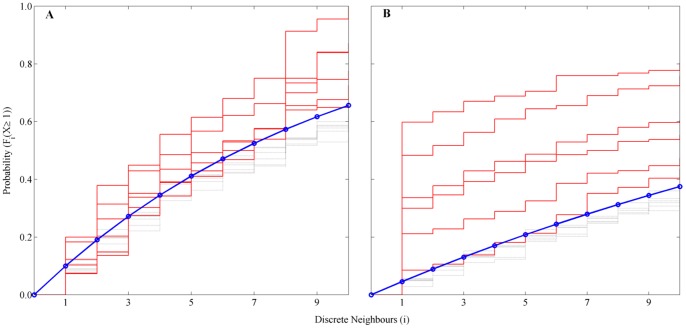
Figure 3. Cumulative probabilities of having at least one discrete neighbour in a neighbourhood i = 1…10; A Small Set and B Large Set.
Solid red lines are the original distribution optimised with fuzzy c-clustering; solid blue line is the average (n = 8) of the six bootstrapped clusters (same length as the original cluster length but bootstrapped over a uniform distribution of sheet membership of all sheets); dotted grey lines are the hypergeometric (analytical) cumulative density functions.

