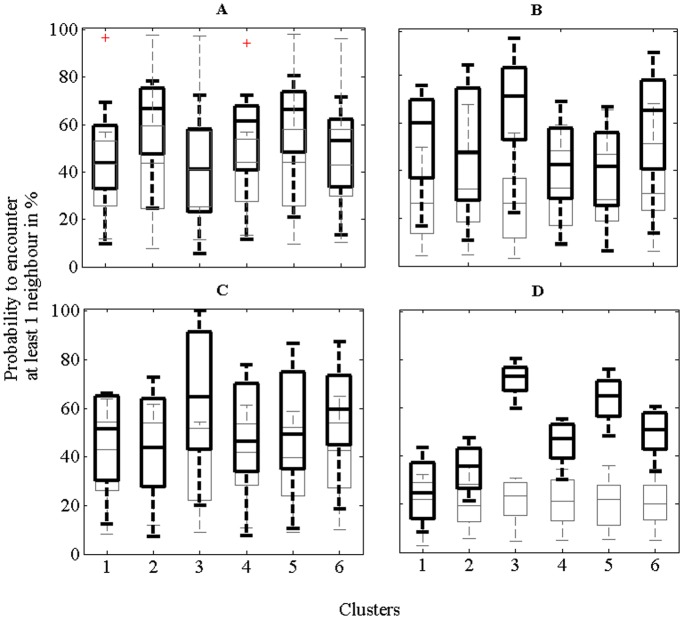
Figure 4. Box plots for the six clusters showing the cumulative probability to obtain at least one same sheet with respect to the neighbourhood function;+are outliers.
Bootstrapped (n = 8) ‘uniform experimental data’ based on the original distribution (thick black lines) benchmarked against uniform distributions (n = 8) with the length of each cluster the same as the experimental data: A Small Set (N = 505) and B Large Set (N = 1417); and with identical cluster length for each set: C Small Set (N = 360) and D Large Set (N = 506).

