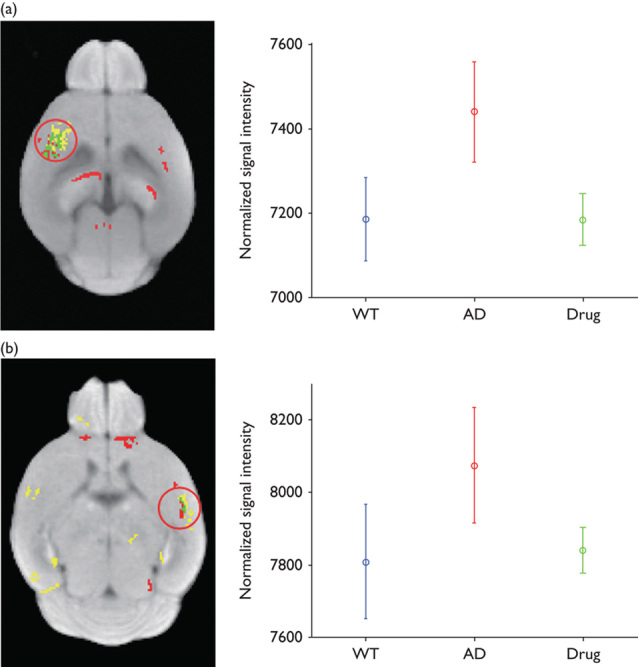
Fig. 4.

Overlapped brain areas of group difference maps, which are detected in Figs 2 and 3 on D+1 (a) and D+3 (b). Red voxels represent statistically different brain areas in Fig. 2. Yellow voxels represent statistically different brain areas in Fig. 3. Green voxels represent overlapped brain areas from Figs 2 and 3. In the right panels, the plots shows the mean and SD of voxels’ normalized signal intensity, which belong to a red circle in the left panels. AD, Alzheimer’s disease; WT, wild-type.
