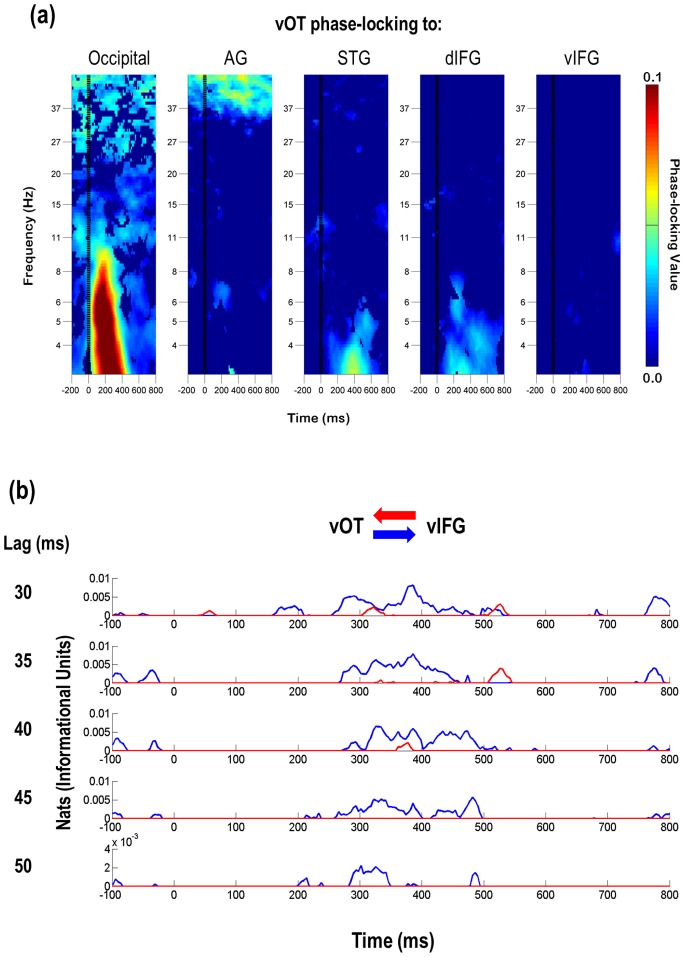
Figure 5. Time-frequency plots of PLVs and outputs from narrow-band transfer entropy (NBTE) analysis.
(a) vOT shows distinct patterns of functional connectivity among the regions in the reading network. PLVs are masked for significance at p = 0.001 by permutation test for individual participants and then again at p = 0.000001 for the group (see Methods). (b) Example of theta-band NBTE (30–50 ms lag) between vOT and vIFG from a single subject. The plot depicts the flow of information between areas, where the blue line represents the transfer of information from vOT to vIFG, and the red line represents information flow from vIFG to vOT. In this case, across all lags, vOT sends information from ∼250–470 ms, followed by vIFG sending information back at ∼500–550 ms, indicating an initial feed-forward response, followed by feedback to the original source. Also shown here are instances in which both NBTE patterns overlap, signifying a bi-directional relationship (e.g., ∼300–400 ms). NBTE results for individual participants were masked for significance at p = 0.05 by permutation test (see Methods). vOT ventral occipito-temporal cortex; AG angular gyrus; STG superior temporal gyrus; IFG inferior frontal gyrus; d dorsal; v ventral.

