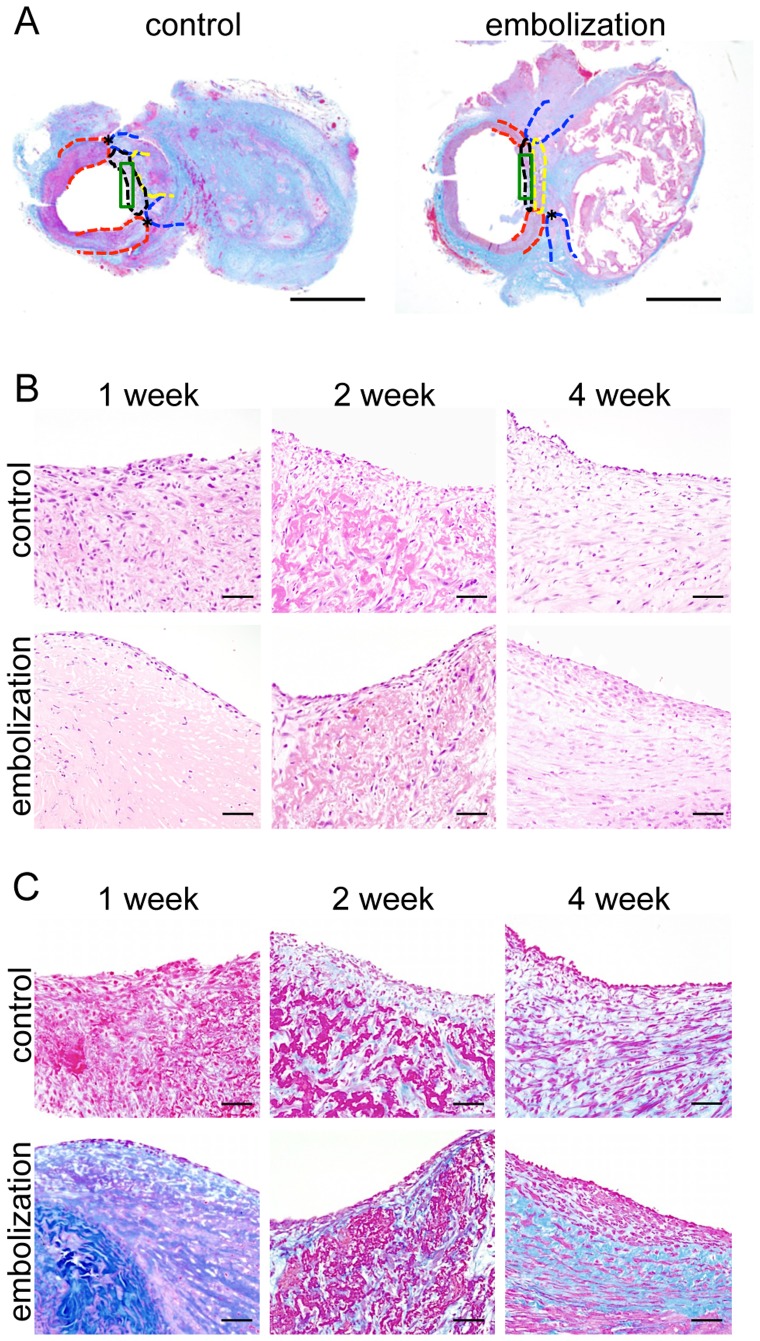
Figure 3. Histology of proliferating tissue.
(A) Photomicrographs of AZAN stained tissue 4 weeks after surgery: red dotted line, artery; blue dotted line, vein; yellow dotted line, thrombosis; black dotted line, proliferating tissue; green enclosure, evaluation area. Scale bars = 2 mm. (B) Photomicrographs of H&E stained tissue 1, 2 and 4 weeks after surgery in the embolization and control groups. Scale bars = 50 µm. (C) Photomicrographs of AZAN stained tissue 1, 2 and 4 weeks after surgery in the embolization and control groups. Scale bars = 50 µm.

