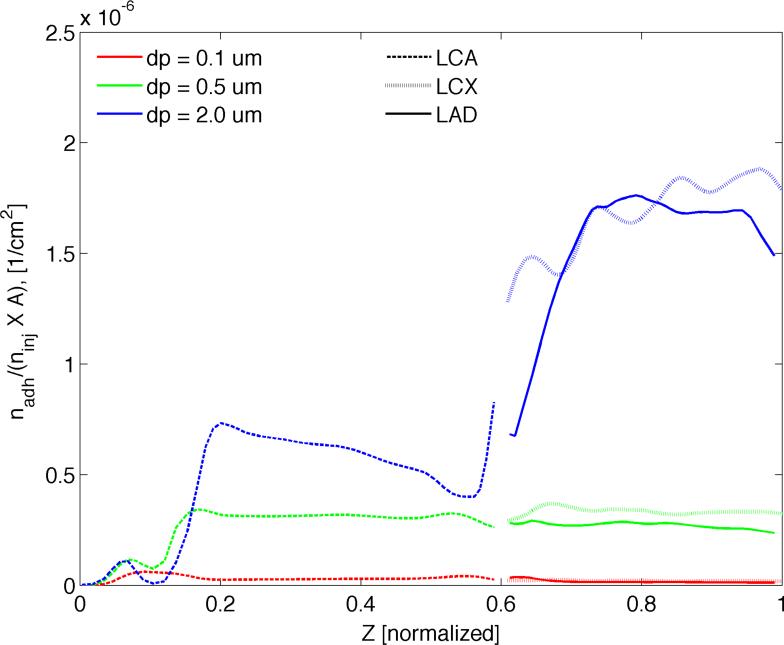
Figure 8.
Comparison of particle size under dual targeting. The number of adhering 0.1, 0.5, and 2.0 μm particles at the end of simulation (t = 9 s) averaged over the circumference of each cross section taken at various “Z”-locations along the vessel centerline. Here nadh is the number of adhered particles, ninj is the total number of injected particles and A (cm2) is the surface area.

