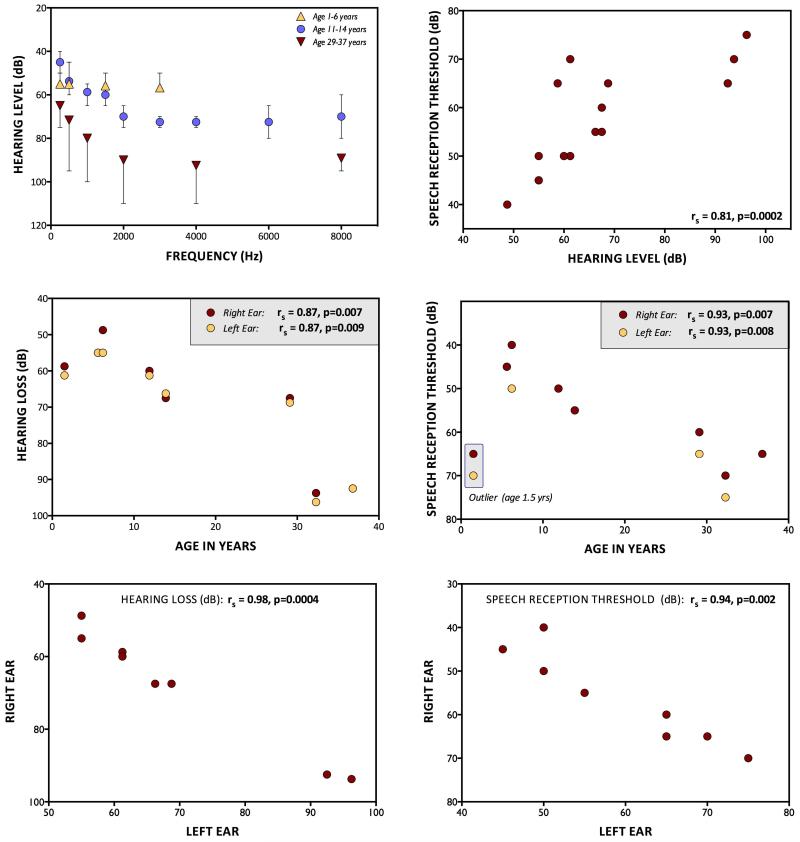
Fig. 4. Behavioral Audiology.
A) Averaged pure tone audiograms for 3 different age groups. B) Speech reception thresholds as a function of pure tone average (0.5, 1, 2, 4 kHz). C) Pure tone average as a function of age. D) Speech reception thresholds as a function of age. E) Pure tone average correlation between right and left ears. F) Correlation of speech reception thresholds between right and left ears.

