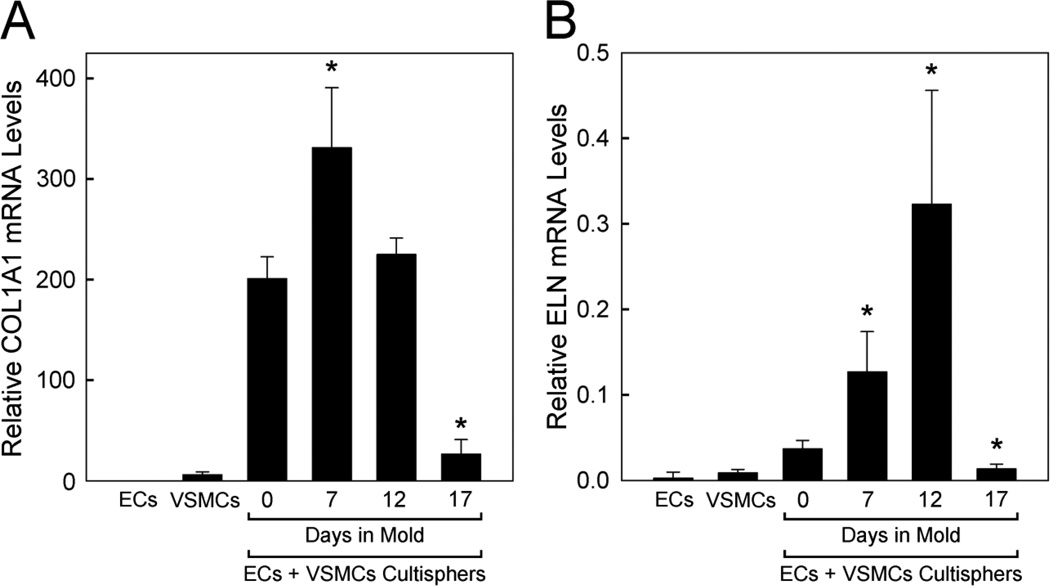
Figure 5.
qPCR analysis of collagen (COL1A1) and elastin (ELN) mRNA expression in vascular cells in 2D culture, vascular cell-containing Cultisphers and tubular constructs. COL1A1 (A) and ELN (B) qPCR were performed on cDNAs prepared from total RNA isolated from endothelial cells (ECs) and vascular smooth muscle cells (VSMCs) cultured separately on tissue culture plastic (5 days in 2D culture), Cultisphers laden with both ECs and VSMCs (5 days in suspension culture, 0 days in agarose molds) or individual tubular constructs (made from cellularized Cultisphers cultured in suspension culture for 5 days followed by culture for 7, 12 or 17 days in agarose molds). The plotted values show relative amounts of mRNA based on 4–6 replicate samples for each. Plotted values are standardized in relation to the reference gene, GAPDH, but similar results were obtained using TBP as a second reference gene (not shown), Asterisks indicate significant differences from levels in 0 days in agarose mold samples, p values <0.05.

