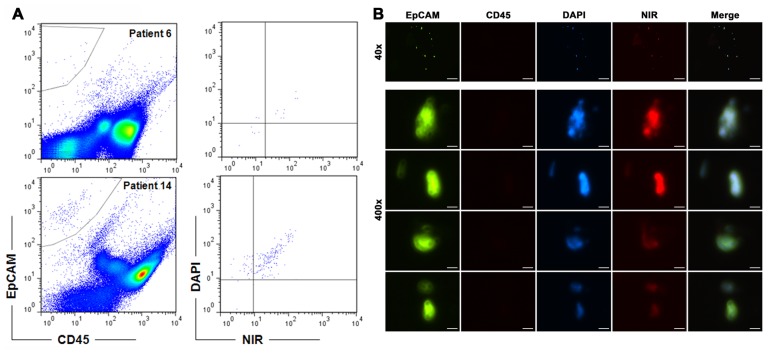
Figure 2. Application of the detection protocol to clinical samples from PCa patients.
Representative detection results are shown. A, upper row shows CTC detection from patient 6, where 10 live CTCs were found. Lower row shows the detection of 148 live CTCs from patient 14. For each sample, gate setting was directed by parallel staining of PC-3 cells. B, CTCs detected from patient 14 were isolated onto a microscope slide and visualized immediately by fluorescence imaging. Low magnification images of a representative field (40×; bar = 250 µm) are shown in the upper row. Below, high magnification images of 2 live CTCs (NIR+) from the same field are shown in the next two rows, in comparison to 2 dead CTCs (NIR−) in the last two rows (400×; bar = 25 µm).

