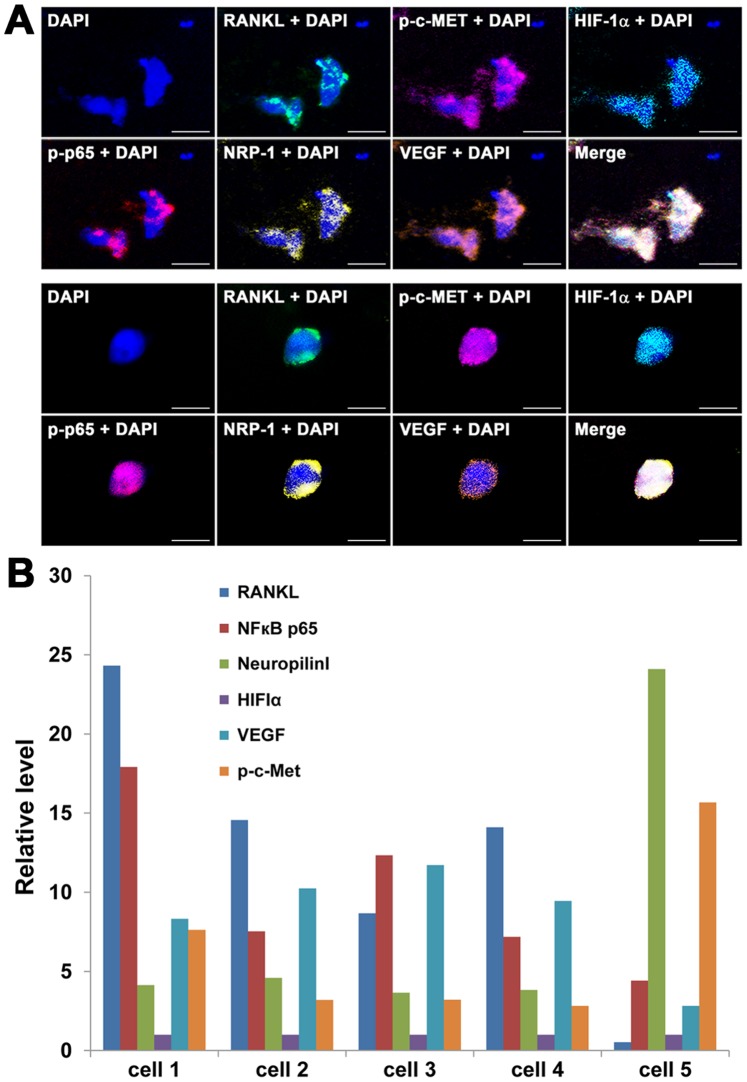
Figure 4. Isolating CTCs for further molecular characterization.
Live CTCs from the first sample from patient 44 (Table 2) were isolated onto a microscope slide and subjected to mQDL staining for the status of a panel of proteins documented to relate to PCa progression. A, Spectral images from two representative CTCs are shown on the top two panels (8 images each that represent the expression level of RANKL, pc-Met, HIF-1α, pp65, NRP-1 and VEGF; 400×; bar = 50 µm). B, Quantification of spectral image intensities of the six proteins indicated in Panel A from five stained cells from the same patient. The relative level of gene expression was calculated based on the expression of HIF-1α which was assigned as 1.0.

