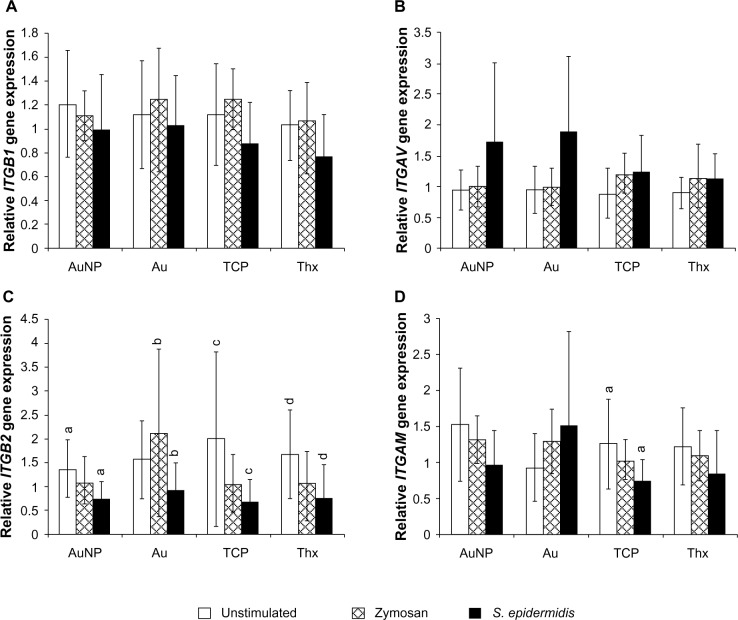
Figure 13.
Gene expression of integrin-β1 (A), integrin-αv (B), integrin-β2 (C), and integrin-αM (D) in adherent monocytes on AuNP, Au, TCP, and Thx after 1 hour of stimulation with either opsonized zymosan particles or opsonized Staphylococcus epidermidis. Unstimulated cells were used as controls.
Notes: Data represent the mean ± standard deviation (n=4–6). Significant differences between stimulus or material surfaces are indicated by letters a–d, where bars that share the same letters are significantly different (P<0.05).
Abbreviations: Au, smooth gold surface; AuNP, nanostructured gold surface; TCP, tissue culture-treated polystyrene; Thx, tissue culture-treated plastic cover slip; ITGB1, integrin-β1; ITGB2, integrin-β2; ITGAV, integrin-αv; ITGAM, integrin-αM.

