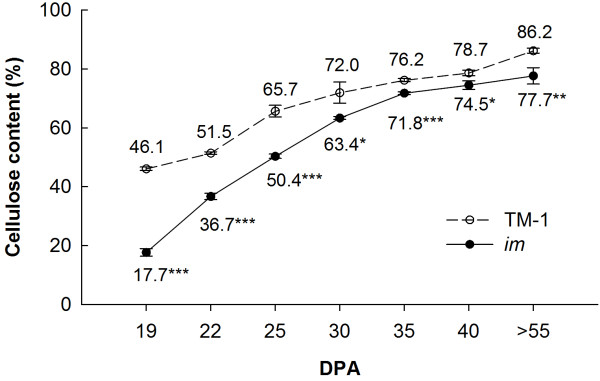
Figure 1.

Cellulose content in fibers in TM-1 and im mutant. Each value is the mean ± SD of three biological replicates. Asterisks indicate significant differences (Student’s t test, *P < 0.05, **P < 0.01, ***P < 0.001) between TM-1 and the im mutant at same developmental stage.
