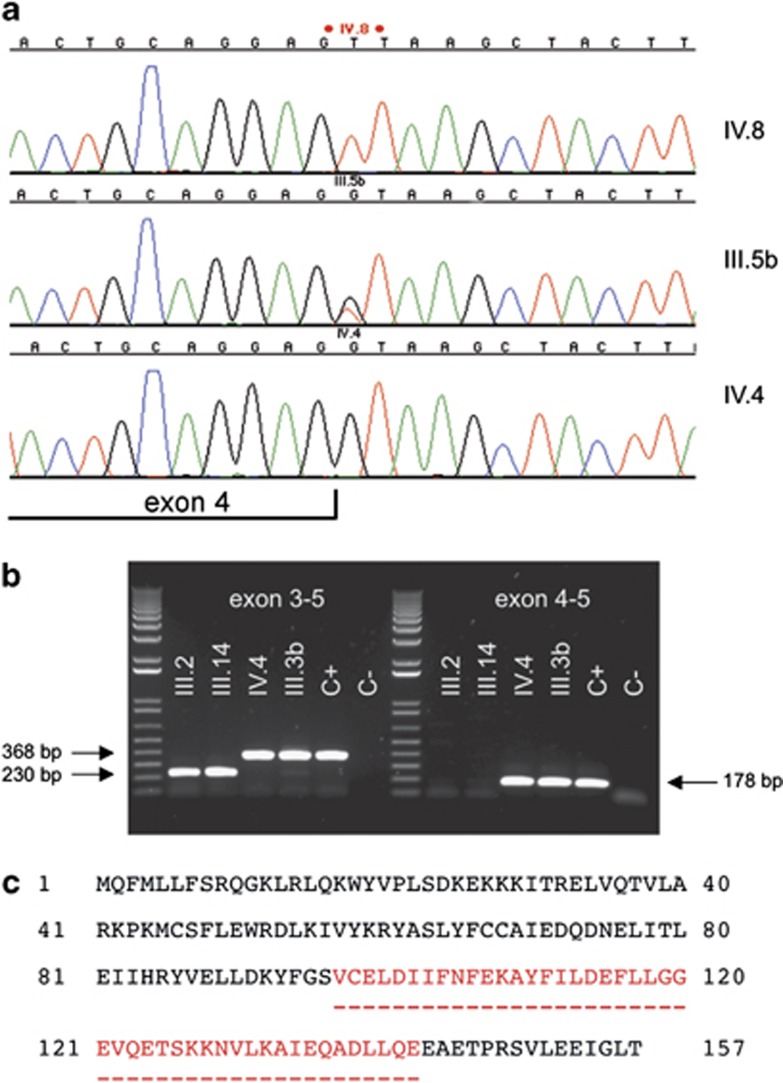
Figure 3.
Characterization of the mutation and its consequence for the AP1S2 transcript and protein. (a) Sanger sequencing of the region containing the c.426+1 G>T mutation (arrow) in an affected male (IV.8), his carrier mother (III.5b) and an unaffected male from the same family (IV.4). The sequence belonging to exon 4 of AP1S2 is labelled. (b) RT-PCR amplification of the AP1S2 transcript using primers located in exons 3 to 5 (left) or 4 and 5 (right) in samples prepared from the lymphoblastoid cell lines of affected individuals (III.2 and III.14), a carrier female (III.3b) and an unaffected male (IV.4). A control sample prepared from the lymphoblastoid cell line of a normal individual was included (C+) together with a negative control (no DNA; C−). The size of the PCR amplicons is indicated. The molecular weight marker is the 1 kb+ DNA ladder (Invitrogen). (c) Schematic representation of the consequence of the c.426+1 G>T mutation, putatively leading to the deletion of 46 amino acids from the AP1S2 protein (p.Val97_Glu142del; indicated by the minus signs below the protein sequence).

