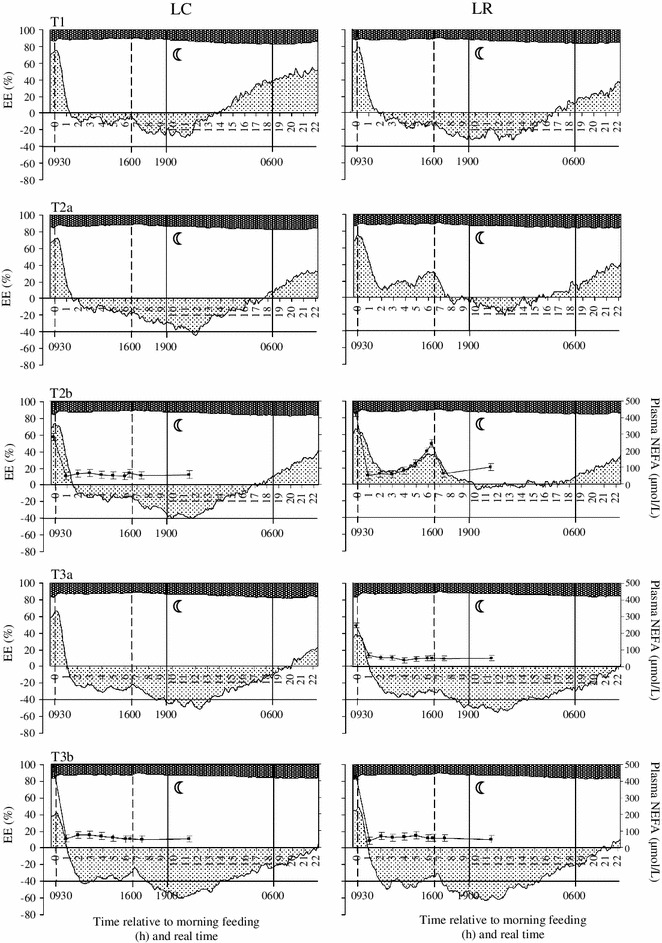
Fig. 3.

Diurnal patterns of fat, carbohydrate and protein disappearance (from bottom to top: fat oxidation, gray shading; carbohydrate oxidation, blank area; protein disappearance, dark shading) expressed as % of total energy expenditure (EE; left y-axis; LSM; SE were omitted for the sake of clarity) and related to plasma NEFA concentration (right y-axis, solid line with filled square; LSM ± SE) in ad libitum fed pigs with low birth weight (LC; left panels; n = 8/group) and food restricted pigs with low birth weight (LR; right panels; n = 8–9/group) before (top panel: T1), during (middle panels: T2a and T2b) and after (bottom panels: T3a and T3b) food restriction. Vertical dashed lines indicate the feeding time points within day. The time period between 1900 and 0600 h marked with a half-moon represents the night phase. Negative fat oxidation values indicate fat synthesis
