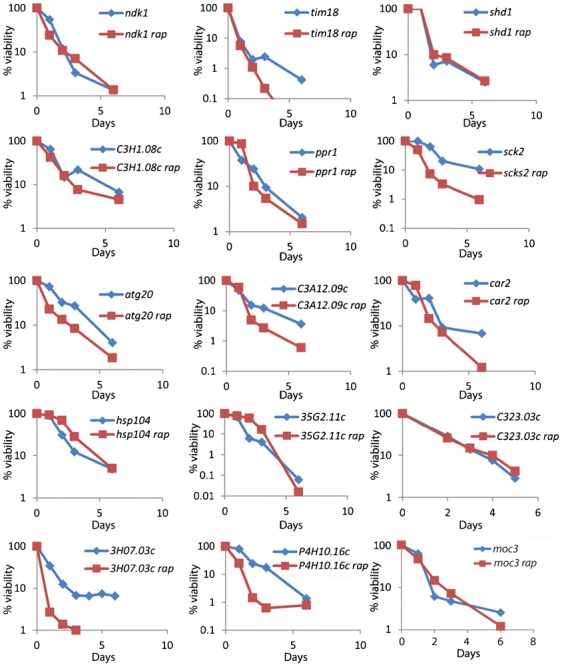
Fig. 3. Comparison of CLS for long-lived mutants with (red) or without (blue) rapamycin treatment during growth phase.

Only the 15 long-lived mutants that exhibited no additional extension of maximal CLS after rapamycin treatment are shown (p>0.05). Supplementary material Fig. S1 shows remaining 6 long-lived mutants that exhibited additional extension of maximal CLS when treated with rapamycin.
