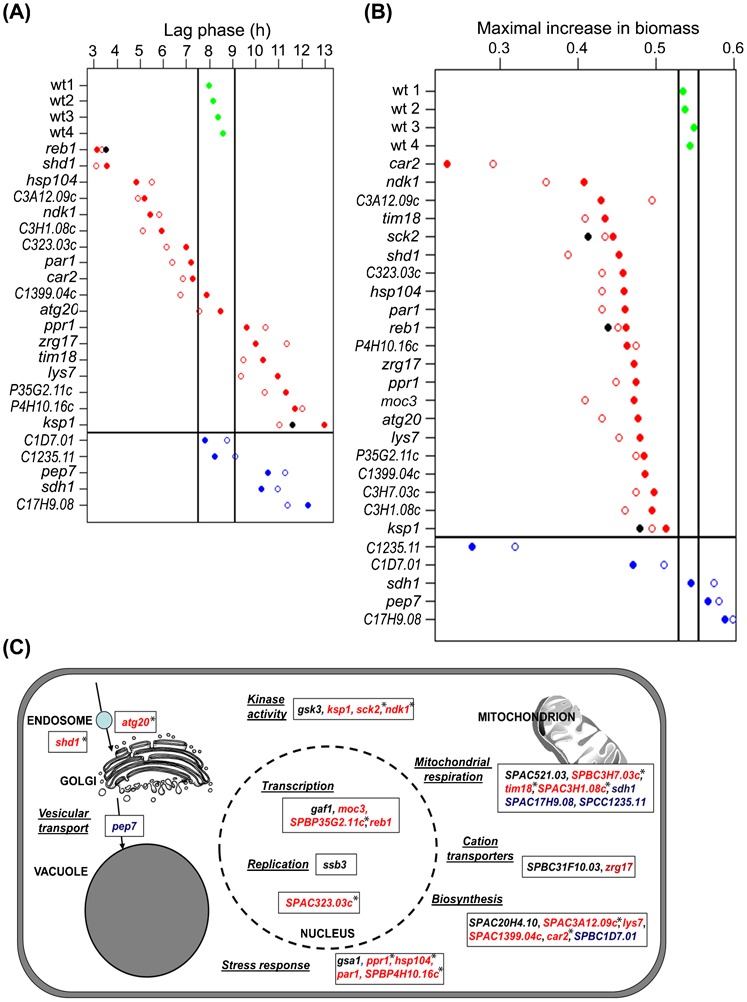
Fig. 6. Stress resistance and growth phenotypes of mutants and gene functions identified in screen.

(A) Lag phases after oxidative stress for mutants compared to wild type. Four independent repeats for wild type were measured (wt1–wt4, green circles), with vertical lines representing 2 standard deviations from mean. Data shown are for 18 original long-lived mutants from library as indicated (solid red circles), for corresponding mutants after back-crossing to wild type (open red circles), for deletion mutants that we independently reconstructed (solid black circles), for 5 original short-lived mutants (solid blue circles), and for corresponding back-crossed strains (open blue circles). The horizontal line separates long- from short-lived mutants. The average of 3 independent biological repeats is shown for each mutant data point. (B) Maximal increase in biomass (relative biomass change per min) of 21 long- and 5 short-lived deletion mutants as indicated, compared to the wild-type cells (colors and symbols as in Fig. 6A). Vertical black lines indicate 2 standard deviations from mean of 4 wild-type repeats. The average of 3 independent biological repeats is shown for each mutant data point. (C) Overview of functional categories identified in mutant screen, set in a cellular and functional context. Genes are color-coded for long- (red) and short-lived (blue) mutants, or mutants without change in CLS (black) compared to wild-type control. Asterisks indicate the long-lived mutants that show no additional CLS extension with rapamycin treatment (Fig. 3), which might represent key targets downstream of TORC1.
