
Fig. 1. Expression pattern of Top2b during mouse retinal development.
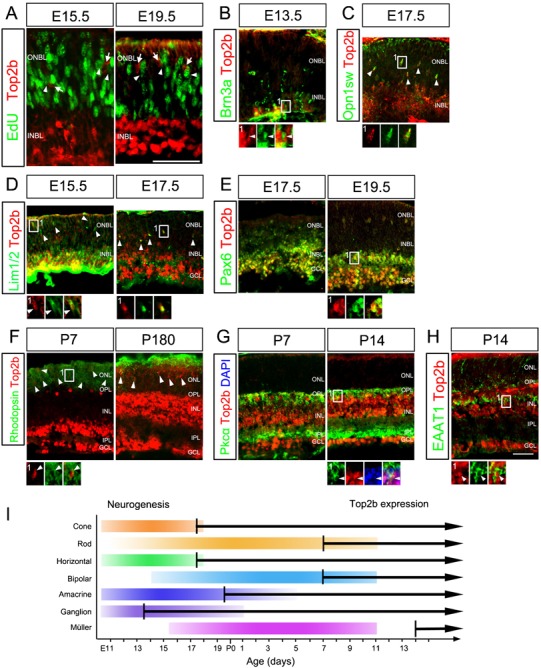
(A) E15.5 and E19.5 retina sections were processed to reveal EdU in vivo labeling. Staining with Top2b show that the vast majority of Top2b+ cells were in the INBL while EdU+ cells were in the ONBL. No EdU+ cells (arrowheads) were co-labeled with Top2b (arrows). (B) Top2b+ cells were co-labeled with Brn3a at E13.5. (C) Top2b+ cells were co-labeled with Opn1sw at E17.5. (D) Co-staining of Lim1/2 and Top2b at E15.5 and E17.5. (E) Co-staining of Pax6 and Top2b at 17.5 and E19.5. (F) Co-staining of Rhodopsin and Top2b at P7 and P180. (G) Co-staining of Pkcα and Top2b at P7 and P14. (H) Co-staining of EAAT1 and Top2b at P14. Boxed regions are shown in a higher magnification. Arrowheads in (B–H) indicate double-labeled cells with Top2b and a retinal cell type specific marker. (I) Timeline of Top2b expression and neurogenesis in mouse retina. Color bars indicate the process of retinal development based on Young's work (Young, 1985a). Black arrows represent the timing of Top2b expression in different retinal cell types. INBL, inner neuroblastic layer; ONBL, outer neuroblastic later; GCL, ganglion cell layer; INL, inner nuclear layer; IPL, inner plexiform layer; ONL, outer nuclear layer; OPL, outer plexiform layer. Scale bars: 50 µm.