
Fig. 6. Increased cell death in Top2b deficient retinas.
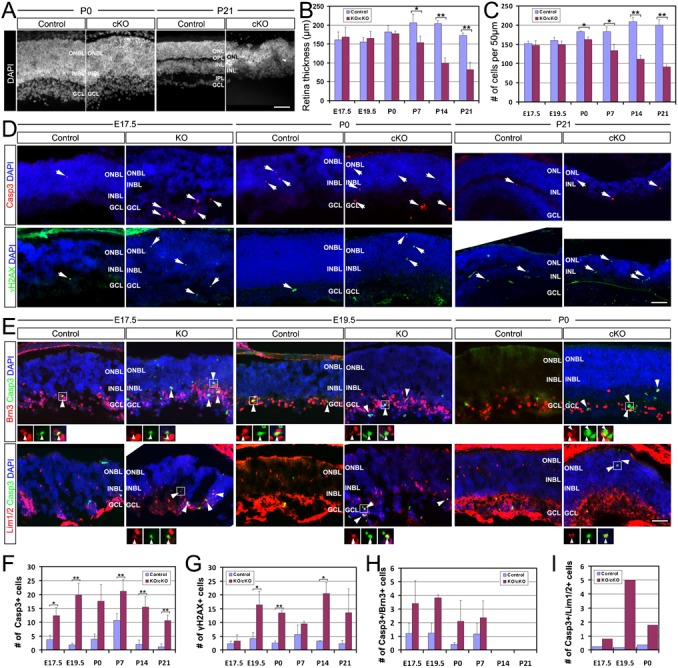
(A) DAPI stained retinal nuclei at P0 and P21. Quantification showed a significant decrease in both retina thickness (B) and the average number of cells (C) in cKO retinas starting from P7 and P0, respectively. (D) Co-staining of retina sections with cleaved caspase 3 (Casp3) and DAPI or γ-H2AX and DAPI. There was a significant increase in the number of Casp3+ and γ-H2AX+ cells in Top2b deficient retinas (D, arrows, F,G). (E) Co-staining of retina sections with Casp3 and Brn3, or Casp3 and Lim1/2. There was a significant increase in Casp3+/Brn3+ and Casp3+/Lim1/2+ cells (E, arrowheads, H,I) in KO/cKO retinas. Error bars are s.d. (n = 3); *p<0.05; **p<0.01. INBL, inner neuroblastic layer; ONBL, outer neuroblastic layer; GCL, ganglion cell layer; INL, inner nuclear layer; ONL, outer nuclear layer. Scale bars: 50 µm.