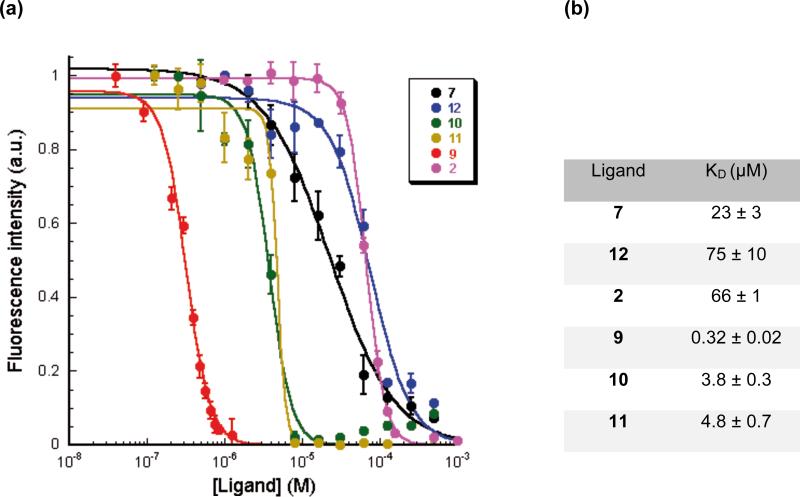
Figure 3.
a) Fluorescence titrations of TAMRA-(CUG)6 with ligands. Comparison of normalized fluorescence intensity change of TAMRA-(CUG)6 in the presence of increasing concentrations of ligands. TAMRA was excited at 560 nm and its emission was recorded at 590 nm. Error bars represent mean ± s.d. of three independent experiments. b) KD was derived by fitting the Fluorescence intensities at different concentrations of ligands into the following equation: where [L] is the concentration of each ligand and Fmax and F0 are the maximum and minimum of normalized fluorescence intensities, respectively.

