Figure 5.

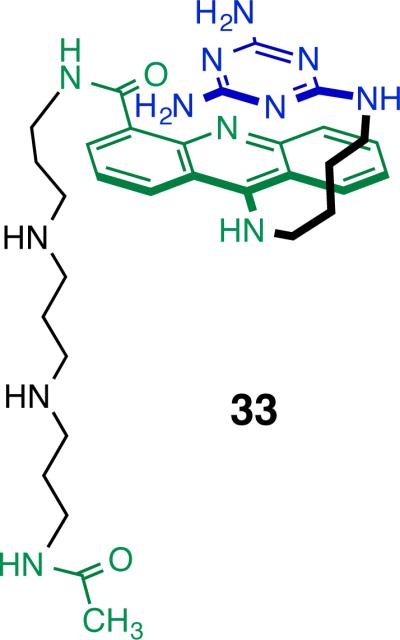
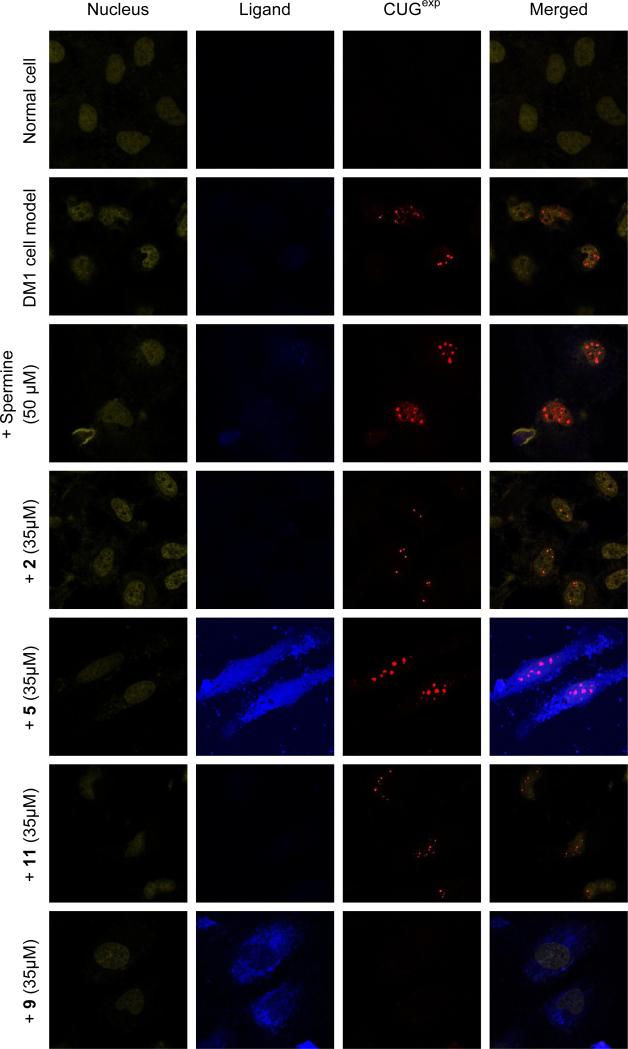
Confocal fluorescent images show CUGexp foci in DM1 model cells are present in rows 2-6, no ligand treatment, treated with spermine (negative control), 2, 9 and 5, respectively. CUGexp foci are not present in negative control cells, row 1, as well as row 7 where DM1 cell model is treated with 9, for 36 h. Corresponding fluorophores in columns 1-3 are TO-PRO-3, Acridine ring and Cy3-(CAG)10 FISH probe, respectively.

