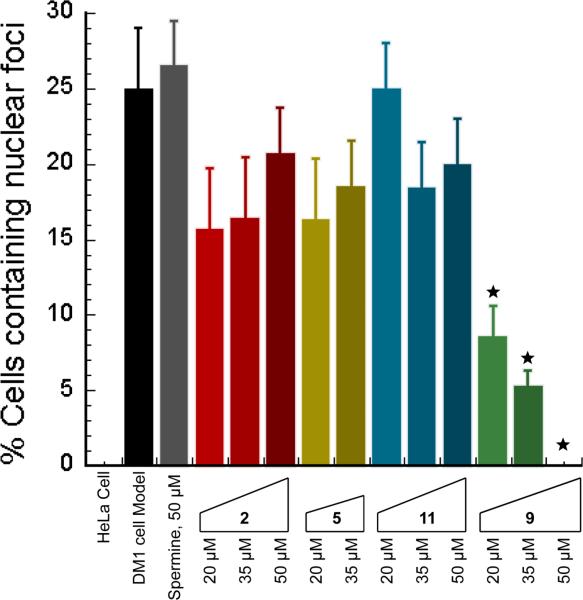
Figure 6.
Plot of CUGexp foci-containing cell fraction at various concentrations of ligands. It is noteworthy that data for ligand 5 (50 μM) was not measurable due to solubility issues. These data are gathered from counting more than one hundred cells. The cells were not counted in a blinded manner, but loss of foci was very apparent. Cells with a single foci were not counted as containing nuclear foci. The error bars represent mean ± standard error of at least three independent experiments. The symbol indicates a p-value < 0.009, otherwise giving a p-value > 0.05.

