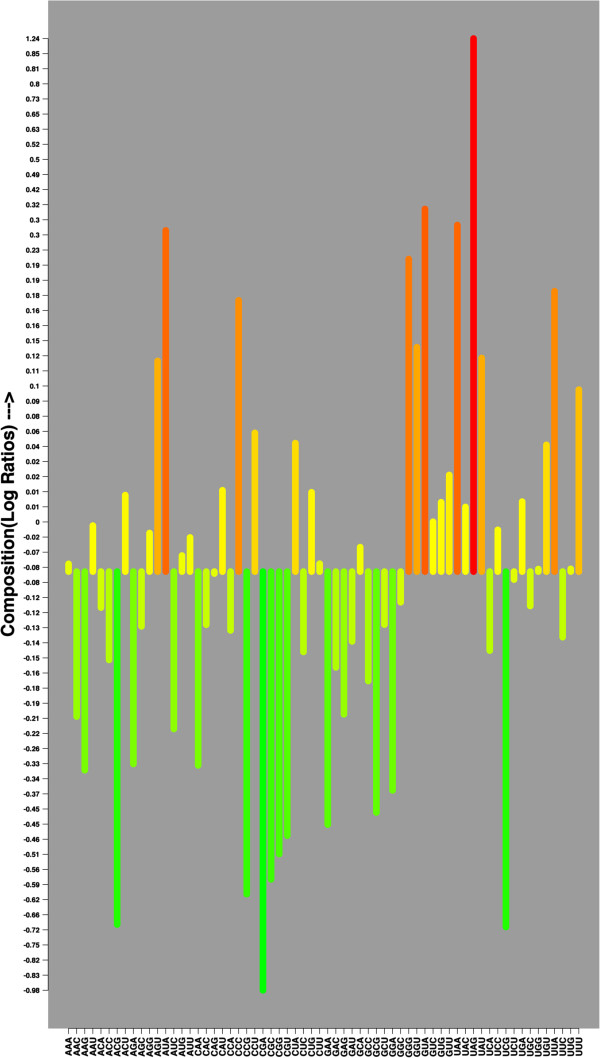
Figure 1.
The comparative average percent tri-nucleotides compositions (TNC) of non-coding and coding RNAs. The y-axis represents the log2 ratio of non-coding to coding TNC values and the height and color of the bars represents the intensity of the Log2 ratios. The greater TNC of non-coding RNAs can be visualized by the upper (red) shaded bars while the lower panel (green) shows the greater occurrence of a Tri-nucleotide in coding RNA sequences.

