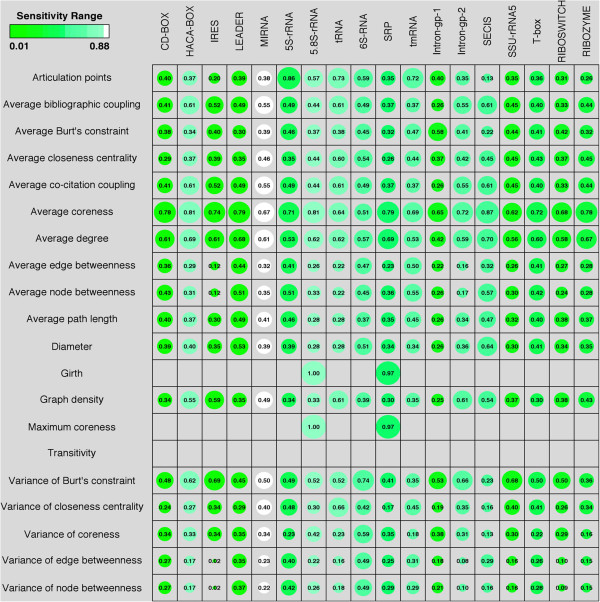
Figure 3.
Relative Graph Properties of different non-coding RNA classes. The diameter of the bubble is scaled according to the value of the normalized (between 0 to 1) graph properties (the value is also numerically shown inside the bubble). The sensitivity of the prediction has been depicted by the color range (increasing from Green to White) of the bubbles. As can be seen miRNAs have the greatest sensitivity where as LEADER RNAs have the least prediction sensitivity. The blank boxes are where graph property values were predicted to be 0 or null.

