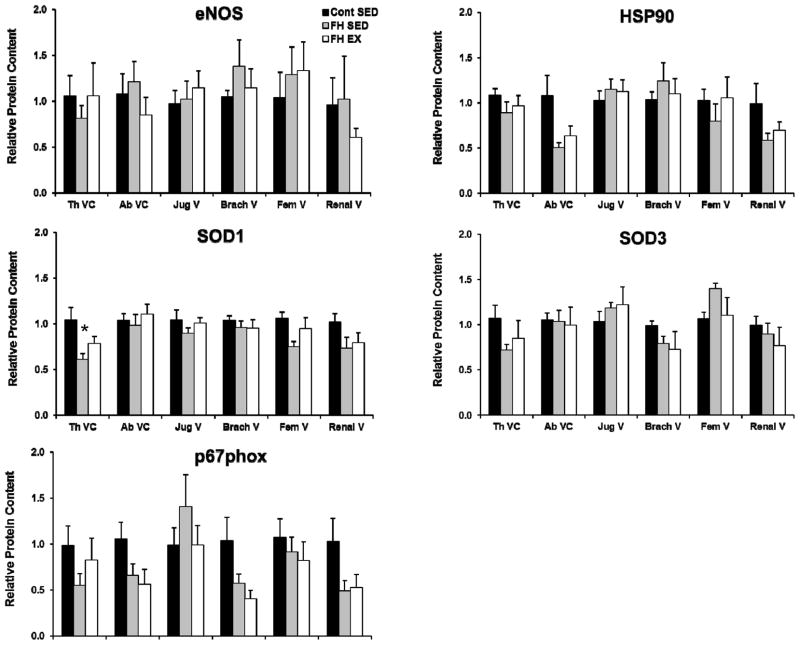
Figure 5.
Differences in protein content within the endothelial cells of the systemic conduit veins between control sedentary, FH sedentary, and FH exercise trained pigs. Values represent protein expression measured in net intensity units and scaled to the average of the value for control animals. * p< 0.05 vs. control pigs. Data are means ± SE; n = 19. SED, sedentary; EX, exercise trained.

