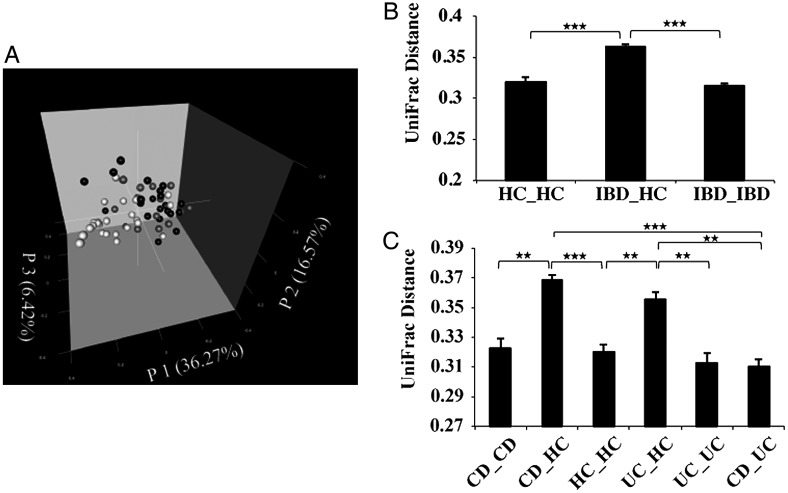
Figure 1.
Analysis of the salivary microbiota of the HC, CD, and UC groups based on 16S data. (A) PCoA plot generated using weighted UniFrac metric. The three components explained 59.26% of the variance. White, grey, and black dots indicate HCs, UC, and CD samples, respectively. (B) Weighted UniFrac distance metric (a measure of differences in bacterial community structure) between HCs and the IBD (CD and UC) groups. (C) Weighted UniFrac distance metric between the HC, CD, and UC groups. Student's t-test was used; *P < 0.01, **P < 10−5, and ***P < 10−10; mean ± s.e.m.

