
Figure 2.
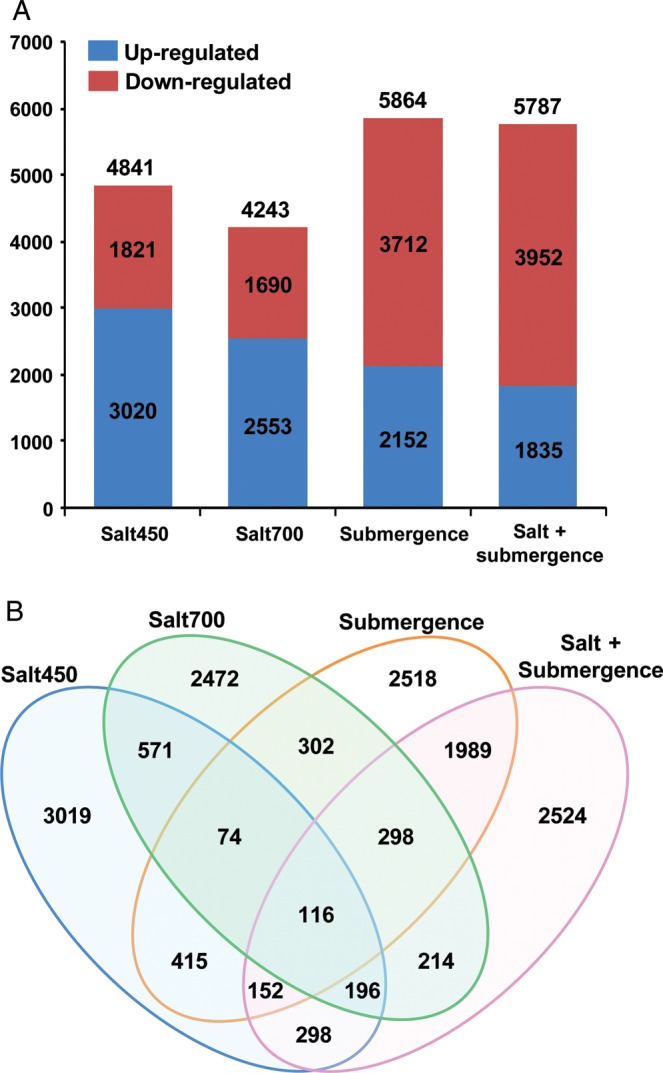
Differential gene expression under different stress conditions. (A) The number of up- and down-regulated genes under different stress conditions (salt450, salt700, submergence and salt + submergence) is shown in the bar graph. The total number of genes differentially expressed under each condition is given on the top of each bar. (B) Venn diagram showing the number of genes differentially expressed under specific or different stress conditions.