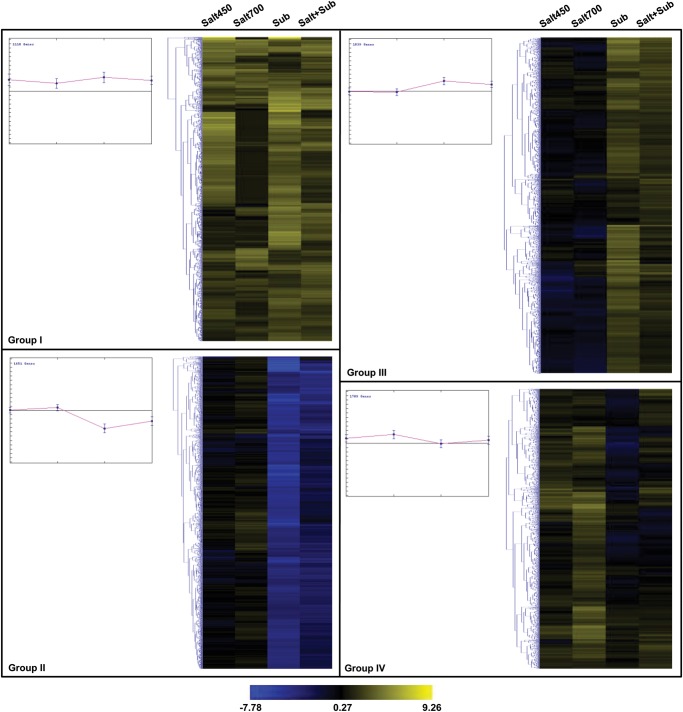
Figure 3.
K-means clustering of expression profiles of genes differentially expressed under different stress conditions. The clustering was performed on log2 fold change for each gene under different stress conditions when compared with under control condition. The genes exhibiting a similar pattern of expression under different stress conditions [salt450, salt700, submergence (sub) and salt + submergence (salt + sub)] have been grouped together in four distinct groups. The scale at the bottom shows log2 fold change. A colour version is available online.

