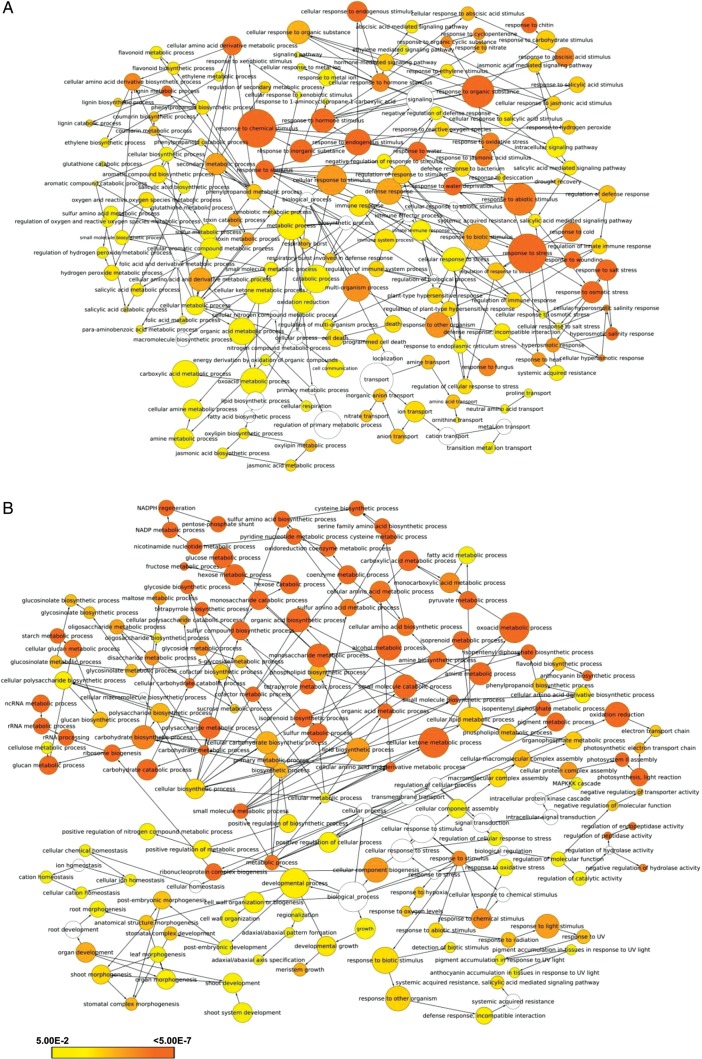
Figure 5.
GO enrichment under different stress conditions. Significantly, enriched GO categories in the up-regulated genes under high salinity (A) and submergence (B) stress are shown. The genes were analysed using BiNGO and the biological process terms showing significant enrichment are shown. Node size is proportional to the number of genes in each category and shades represent the significance level (white—no significant difference; scale, P = 0.05 to P < 0.0000005). A colour version is available online.

