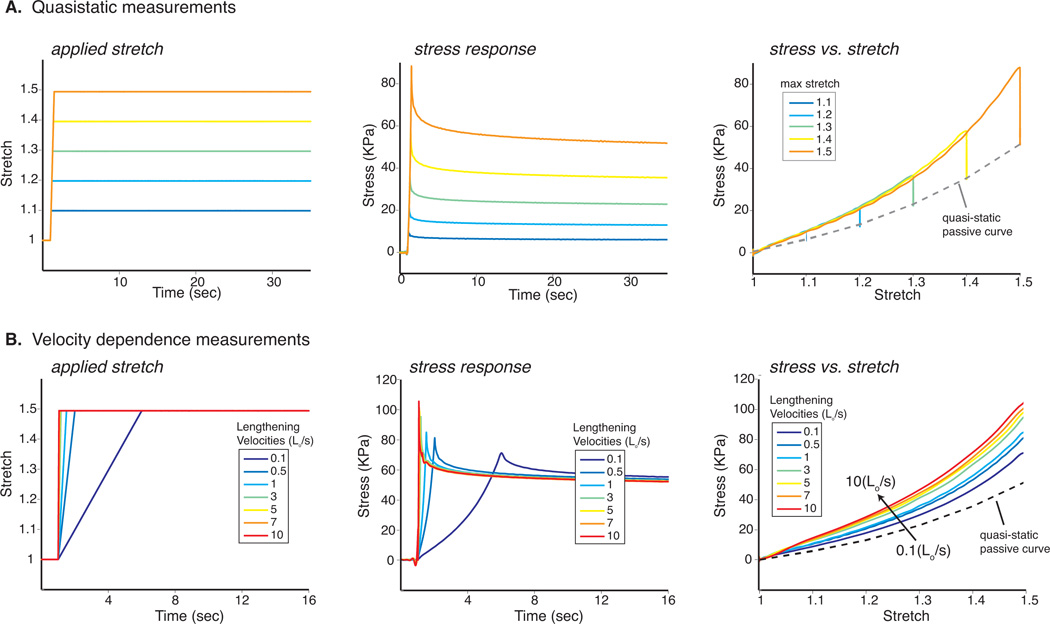
Figure 3.

Quasi-static and Velocity Dependent Responses. A ramp-hold test at a rate of 1 Lo/s was applied to each fiber. The force response was measured while holding the fiber stretch for 30 seconds. This protocol was repeated for stretch values of 1.1, 1.2, 1.3, 1.4, and 1.5 (Fig 3A). Stress was calculated from force and cross-sectional area and steady state was estimated at the end of 30 seconds. Ramp hold tests were conducted by stretching fibers to 1.5Lo at 13 different lengthening velocities ranging from 0.1 to 10 fiber lengths per second (Lo/s) (Fig 3B). Sarcomere lengths and fiber diameters were measured at 1Lo and 1.5Lo and were used to calculate stress. Stress responses for all fibers were averaged for each individual loading rate and subsequently plotted vs. time and stretch.
