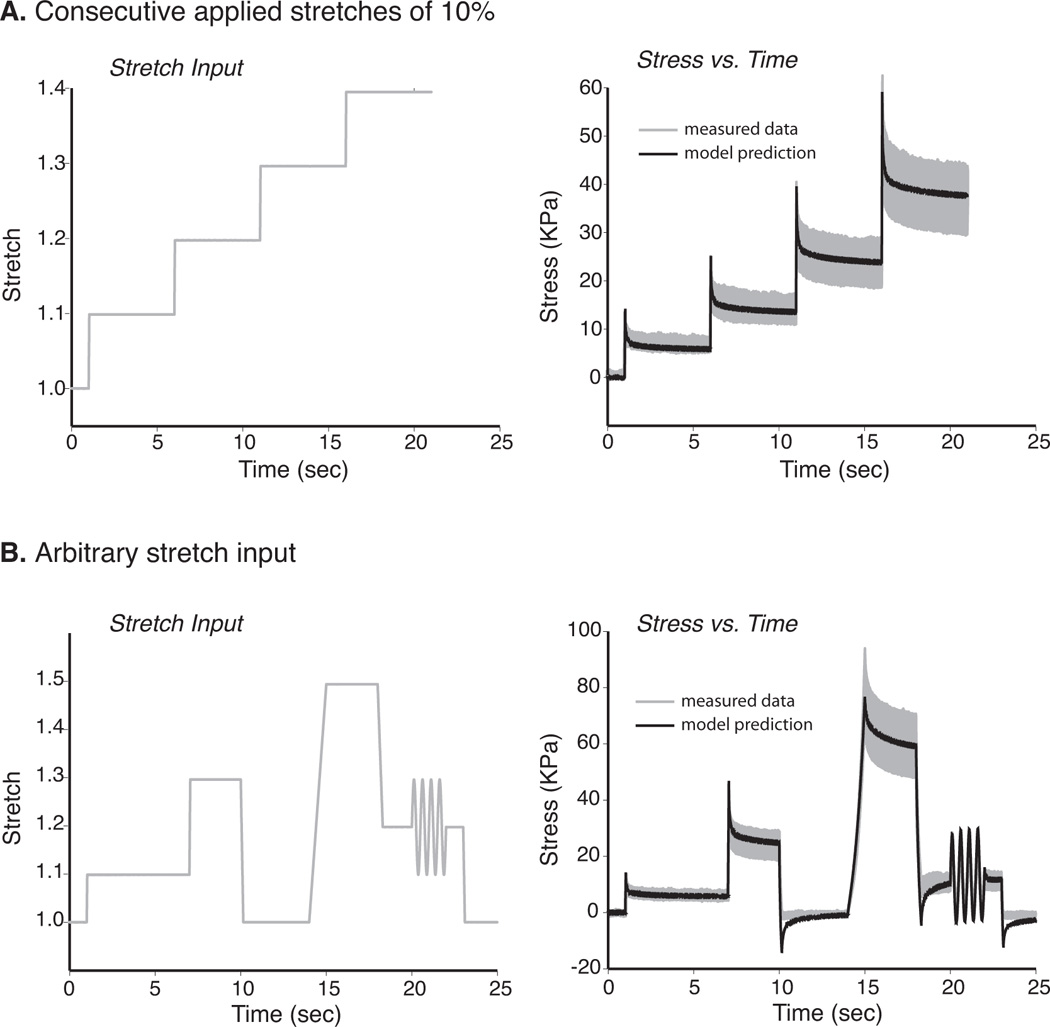
Figure 5.

Evaluation of Model Predictive Capacity Given Variable Loading Histories. Two different loading protocols were considered in order to evaluate the predictive power of the model. 1) Four consecutive ramp inputs of 10% stretch were applied to all fibers. This stretch history was input into the viscoelastic model and used to predict stress and compared to the average stress response as calculated for the set of all fibers (Fig. 5A (shaded region = ±1 std) 2) A second more complex protocol (“arbitrary stretch input”) consisted of various levels and velocities of ramp and sinusoidal stretch inputs. This loading history was input into the model and compared to measured data (Fig. 5B). For both loading protocols, the model closely predicted the experimental measurements.
