
Figure 4.
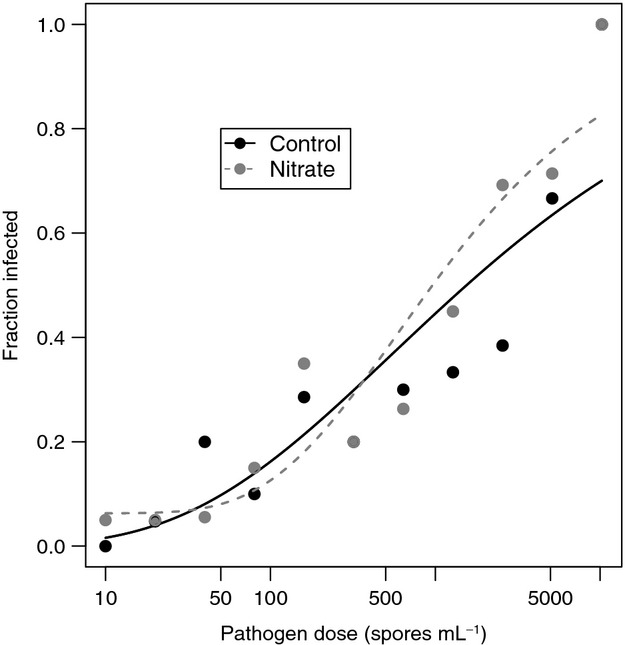
Prevalence increased with increasing pathogen dose in the typical sigmoid fashion, but there was no evidence for a difference in the shape of the dose–response relationship between individuals in control media (solid line; black points) relative to those in media containing increased nitrate levels (dashed line; gray points). Plotted lines are model fits from a three-parameter Weibull dose–response model, with the upper limit fixed at 1, determined to be the best fit model through model selection (Table 1).