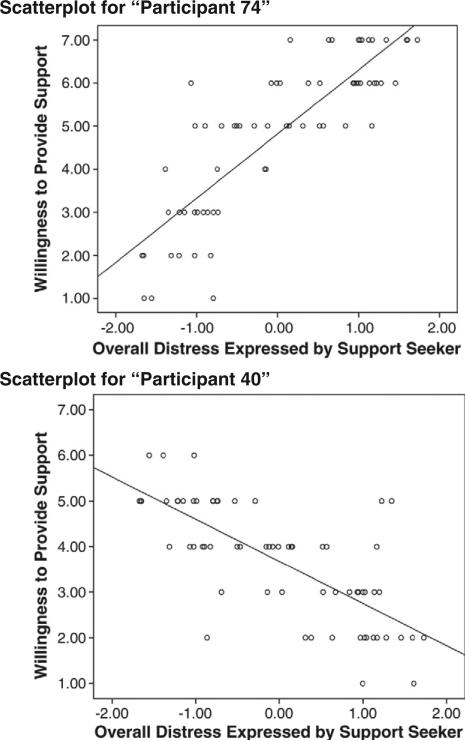
Fig. 3.
Individual scatterplots for the relationship between support seekers’ levels of overall distress and support providers’ willingness to provide support. Each scatterplot represents a single participant's response to each of the 65 support seekers. For participant 74, r = .841 (p < .0001). For participant 40, r = −.731 (p < .0001). Participant 74's Personal Distress score was 3.14 (0.84 SD above the mean for the sample of participants). Participant 40's Personal Distress score was −1.86 (1.29 SD below the mean for the sample of participants).

