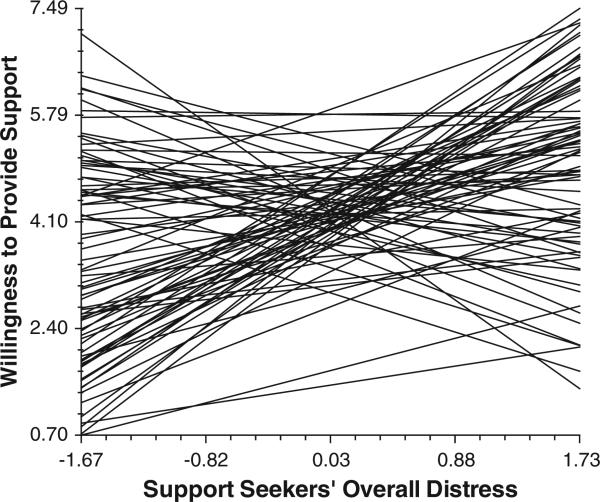
Fig. 4.
Regression lines for 80 participants showing each person's relationship between support seekers’ Overall Distress and participants’ willingness to provide support. Each line represents a regression line drawn for each participant, based on the 65 observations available per participant. While many of the slopes are positive, some are more positive than others. Furthermore, some slopes are negative, meaning that these participants’ willingness to provide support decreased as support seekers’ distress increased.

