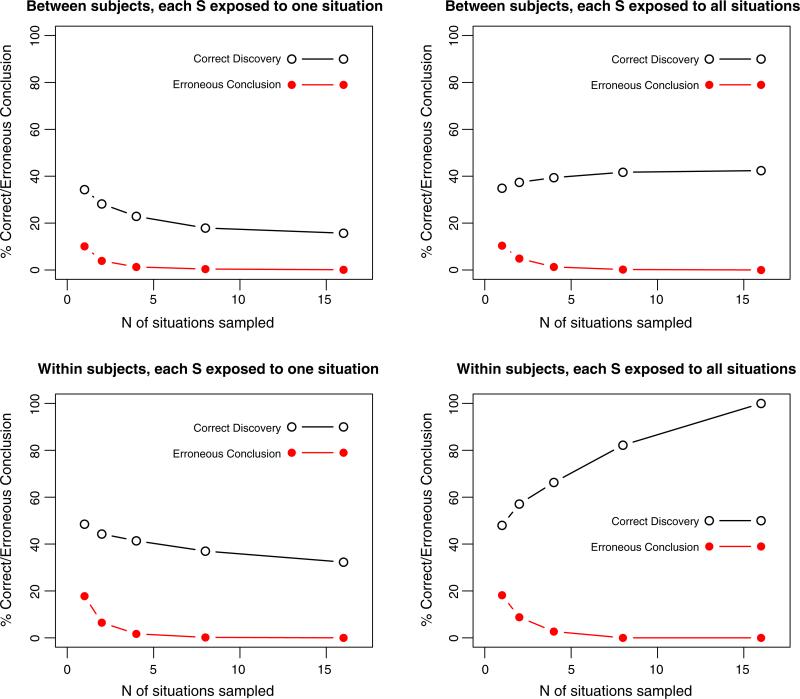
Fig. 6.
The effects of experimental designs on correct discovery and false discovery rates. In each panel, the Y-axis represents the proportions of simulated experiments producing statistically significant results in the correct direction (labeled “Correct Discovery”) and statistically significant results opposite the correct direction (labeled “False Discovery”). The top panels show results of simulated experiments that used a between-subjects design, and the bottom panels show a within-subjects design. The left panels show simulated experiments in which each participant was exposed to only one version of the experimental condition(s) to which they were assigned (referred to as “situation(s)”), and the right panels are for designs in which each participant was exposed to all versions of the conditions to which they were assigned. The X-axis represents the number of versions of each experimental condition included in a study.

