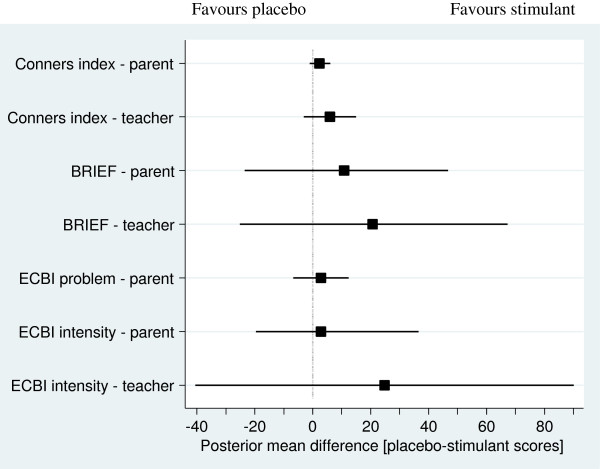
Figure 2.
Overall posterior population estimates of the mean difference between stimulant and placebo score (square) together with associated 95% credible region (line) for each study instrument. Placebo minus stimulant scores are shown. Lower scores indicate less disturbance of behaviour. Scores above zero favour stimulants and below zero favour placebo. Crossing the line means a result is non-significant.

