
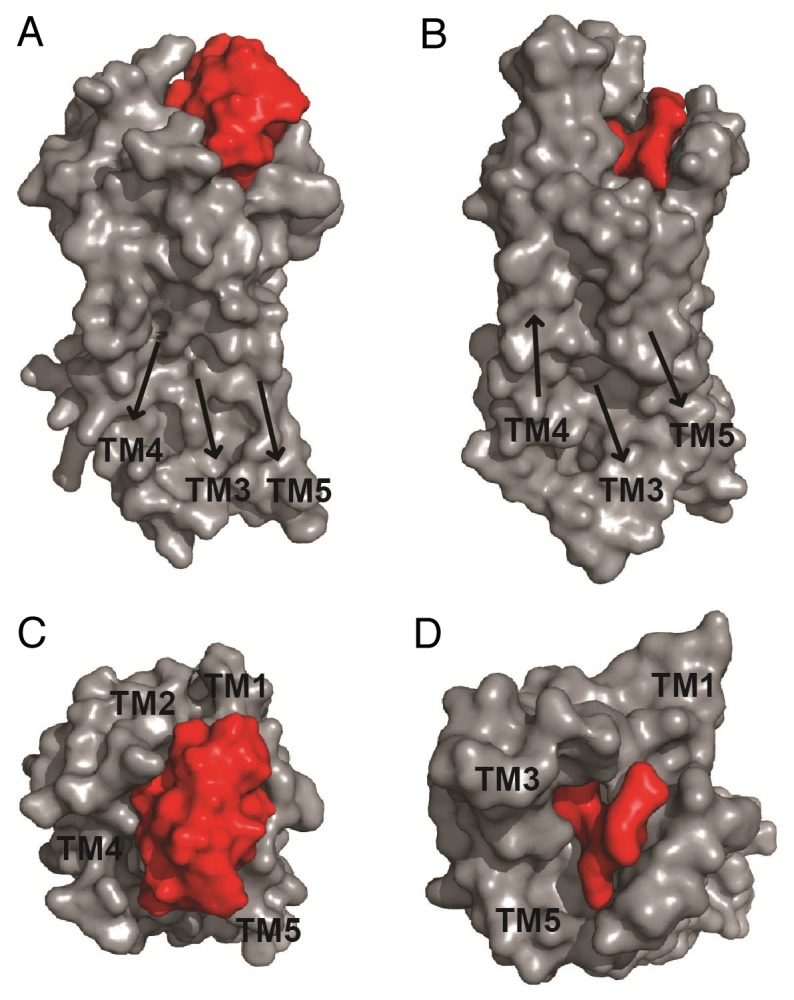
Figure 2. Comparison of ligand-bound oxytocin- and neurotensin receptors. The NMR structure of kalata B7 (PDB ID: 2M9O) was fitted into the cavity of a model of the human oxytocin receptor (OTR) based on the mouse µ-opioid crystal structure (A, C).13 The structure of the ligand-bound rat neurotensin receptor (NTSR, PDB ID: 4GRV) receptor is shown for comparison (B, D). Surface representations of both receptors are shown from (A, B) side view and (C, D) top view. Peptide and receptor are colored in red and gray, respectively. Arrows indicate orientations of transmembrane domains (TM). Images were prepared using PyMOL.