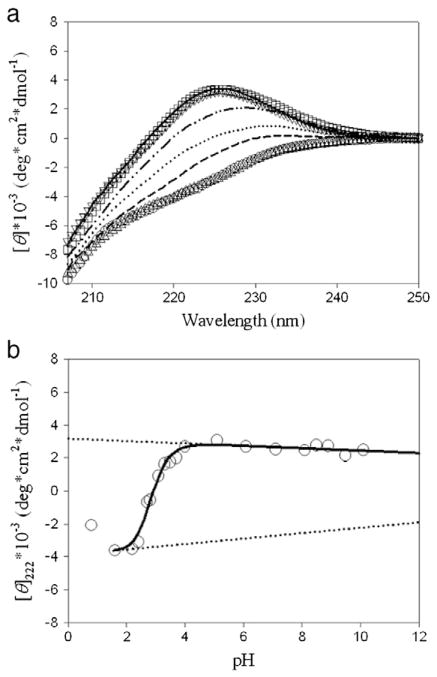
Fig. 2.
Far-UV CD experiments of hNck2 SH3 domain as a function of pH. Protein concentration was between 0.9 and 1.1 mg/ml below pH 7, and between 0.5 and 0.8 mg/ml above pH 7. (a) Far-UV CD spectra at various pH. pH 0.8 (dash), pH 1.6 (circle), pH 2.2 (triangle up), pH 2.7 (dot), pH 3.1 (dash–dot–dot), pH 4.0 (square), pH 6.1 (solid line) and pH 8.1 (triangle down), respectively. (b) [θ]222 dependence of pH-induced helix-β transition of hNck2 SH3 domain. A continuous line represents the theoretical curve based on Eq. (1) (except pH 0.8) [10]. Broken lines indicate the θH and θN values.

