Fig. 2.
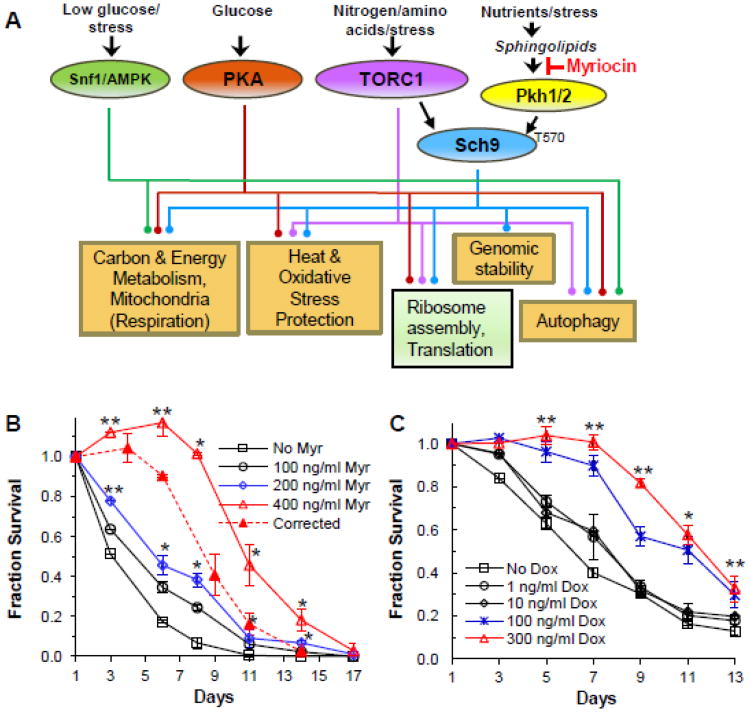
Decreasing the rate of yeast sphingolipid synthesis increases lifespan. A. This diagram summarizes known links between inducers (nutrients and stresses), protein kinases and signaling pathways, and cellular processes modulated by myriocin treatment that have known roles in CLS. The cellular processes are based upon GO terms enriched in the myriocin-responsive gene set and which were verified by targeted experiments [48]. Activation, inhibition and repression are not indicated in order to emphasize linkage relationships. Details about signaling pathways can be found in a review [120]. The brown-shaded rectangles indicate up- regulated processes and green-shaded boxes indicate down-regulated processes (Figure adapted from) [48]. B. CLS of DBY746 cells treated myriocin (400 ng/ml) to reduce the rate of sphingolipid synthesis. Data represent the mean ± SEM of surviving cells (* p<0.05, ** p<0.01, No Myr vs 200 and 400 ng/ml Myr). To compensate for the slow growth and extended growth phase of cells treated with 400 ng/ml of myriocin (solid red line), the viability at the 120 hr time point, CLS day 3, was set as CLS day 1 (dashed red line). C. CLS of tetO7-LCB1 cells treated or not treated with doxycycline (100 ng/ml) to reduce gene expression and lower the rate of sphingolipid synthesis. Data show the mean ± SEM of surviving cells (* p<0.05, ** p<0.01, No Dox vs doxycycline). Panels B and C are reproduced with permission [47].

