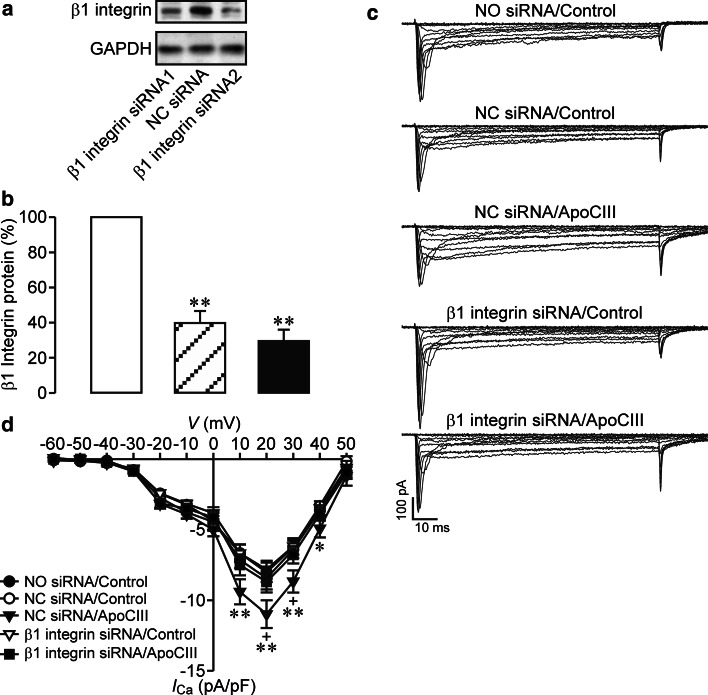
Fig. 7.
Knockdown of β1 integrin abrogates apolipoprotein CIII-induced exaggeration of whole-cell Ca2+ currents in RINm5F cells. a Representative blots of β1 integrin- and GAPDH-immunoreactive bands in β1 integrin siRNA #1-, negative control siRNA (NC siRNA)- and β1 integrin siRNA #2-transfected cells. b Immunoblot quantifications of β1 integrin protein in NC siRNA- (open column, n = 6), β1 integrin siRNA #1- (hatched column, n = 6) and β1 integrin siRNA #2-transfected RINm5F cells (filled column, n = 6). **p < 0.01 versus NC siRNA. c Sample whole-cell Ca2+ current traces registered in individual cells following mock transfection and incubation with control vehicle (NO siRNA/Control, cell capacitance: 12.1 pF), NC siRNA transfection and control vehicle treatment (NC siRNA/Control, cell capacitance: 11.4 pF), NC siRNA transfection and apolipoprotein CIII (ApoCIII) incubation (NC siRNA/ApoCIII, cell capacitance: 12.1 pF), β1 integrin siRNA transfection and exposure to vehicle solution (β1 integrin siRNA/Control, cell capacitance: 11.9 pF) and β1 integrin siRNA transfection and ApoCIII exposure (β1 integrin siRNA/ApoCIII, cell capacitance: 12.4 pF), respectively. d Ca2+ current density–voltage relationships in cells subjected to NO siRNA/Control (filled circles, n = 29), NC siRNA/Control (open circles, n = 28), NC siRNA/apoCIII (filled triangles, n = 28), β1 integrin siRNA/Control (open triangles, n = 29) and β1 integrin siRNA/ApoCIII (filled squares, n = 29). *p < 0.05 and **p < 0.01 versus NO siRNA/Control, NC siRNA/Control and β1 integrin siRNA/Control. +p < 0.05 versus β1 integrin siRNA/ApoCIII

