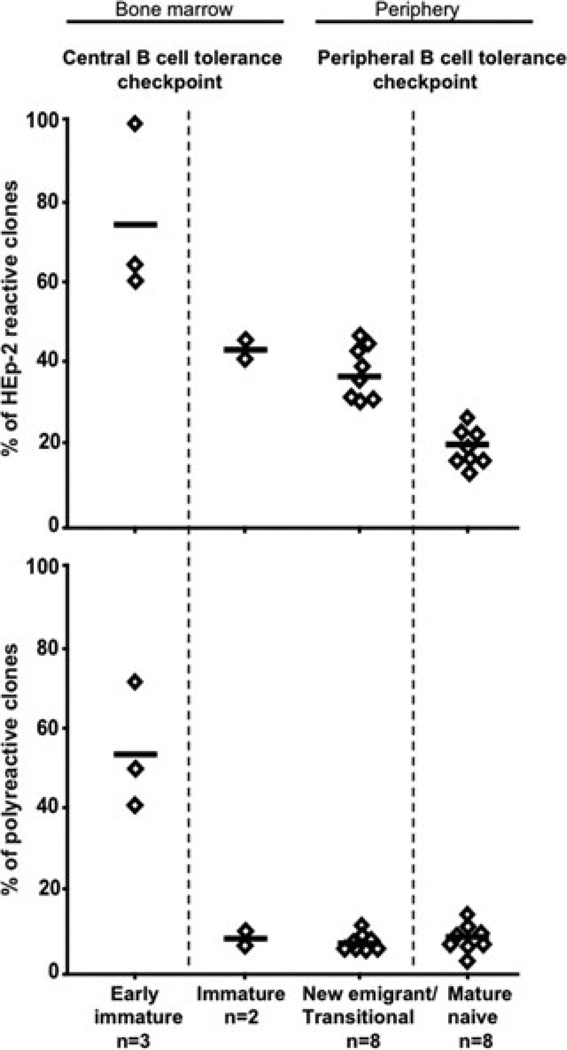
Figure 1.
Early B cell tolerance checkpoints in healthy donors. Single CD34−CD19+CD10+IgM− early immature B cells and CD34−CD19+CD10+IgM+ immature B cells from bone marrow and CD19+CD10+IgM++CD27− new emigrant/transitional and CD19+CD10−IgM+CD27− mature naive B cells from peripheral blood of healthy controls were isolated by flow cytometry based on the indicated surface markers. IgH and IgL chain genes from single purified B cells were cloned, and the monoclonal antibodies were expressed in vitro.7 The frequency of HEp-2 reactive antibodies (top panel) was determined by HEp-2 cell ELISA and indirect immunofluorescence on HEp-2 cells. The frequency of polyreactive antibodies (bottom panel) was determined by ELISA with ssDNA, dsDNA, insulin, and lipopolysaccharide as antigens. Polyreactive antibodies recognized at least two structurally diverse antigens and often all four. Each diamond represents an individual; the average is shown with a bar. The central and peripheral B cell tolerance checkpoints are indicated.

