Figure 2.

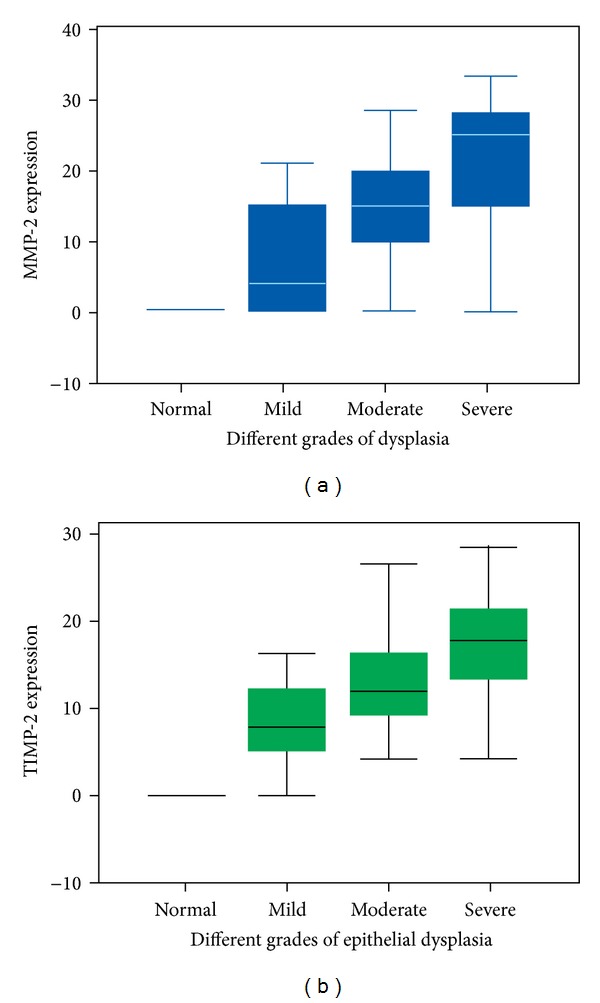
Box plot comparing the median frequency of expression in each the histological grades of dysplasia. (a) MMP-2 expression; (b) TIMP-2 expression.

Box plot comparing the median frequency of expression in each the histological grades of dysplasia. (a) MMP-2 expression; (b) TIMP-2 expression.