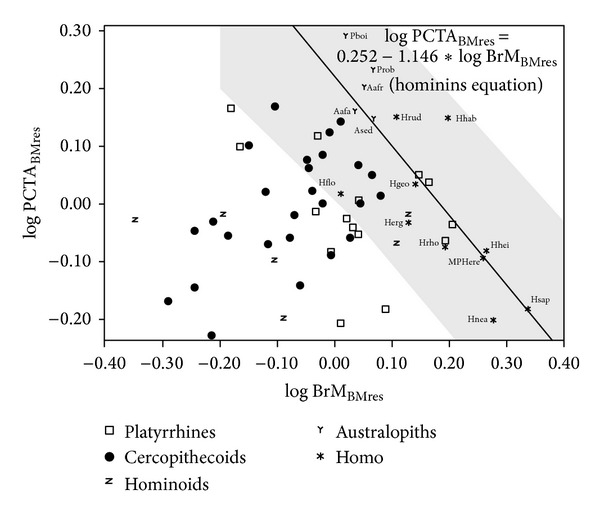
Figure 4.

Bivariate plot of the residuals of postcanine tooth area (PCTA) on body mass (BM) over the residuals of brain mass (BrM) on BM. The regression line and its 95% confidence interval (grey shadow) were adjusted with data for fossil hominins. For species abbreviations, see legend of Figures 1 and 3.
