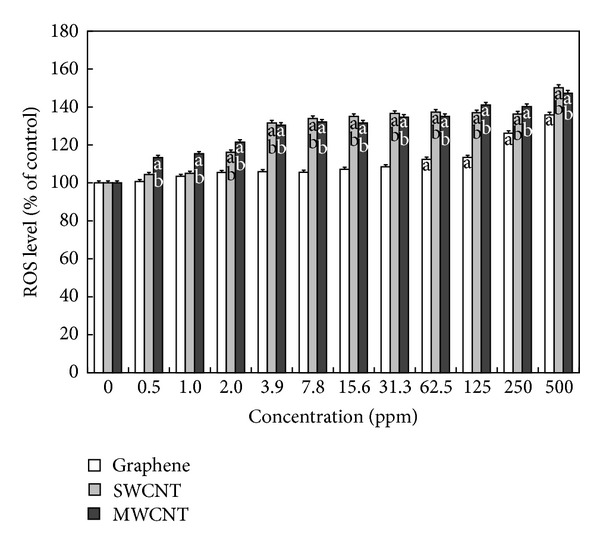
Figure 3.

Effects of graphene, SWCNTs, and MWCNTs on ROS generation in PC-12 cells. Cells were treated with different concentrations of CNMs for 24 hours. At the end of the incubation period, the DCF assay was performed to evaluate the cytotoxicity as described in Section 2. Data were expressed as mean ± standard deviation (SD) based on at least duplicate observations from three independent experiments. The letter “a” indicates statistically significant difference from the untreated control; the letter “b” indicates statistically significant difference from cells treated with graphene at the same concentration (P < 0.05).
