
Fig. 2.
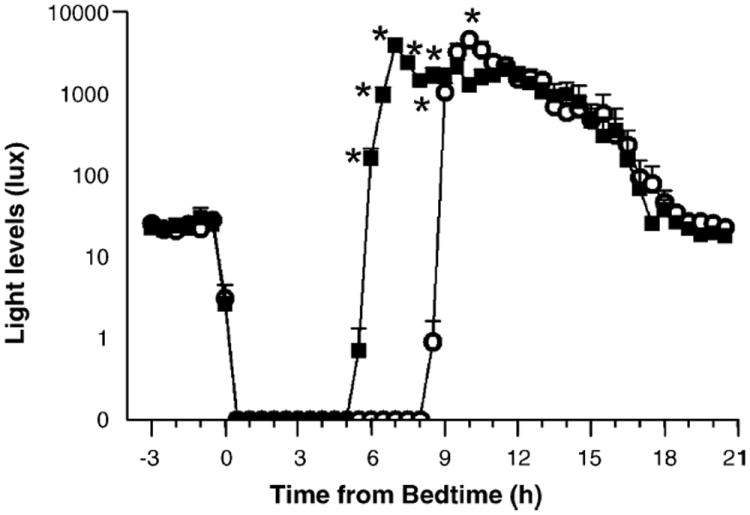
Mean light levels from medallion photosensor during the 2 weeks of short nights with the early wake time (filled squares) and 2 weeks of long nights with the late wake time (open circles), averaged into 30 min bins. Data are averaged according to time from bedtime and are corrected for sunglasses use. Error bars represent S.E.s. Asterisks indicate times when the light intensity was significantly different between the conditions (data log transformed, repeated measures ANOVA followed by simple main effect analysis, p < 0.001).