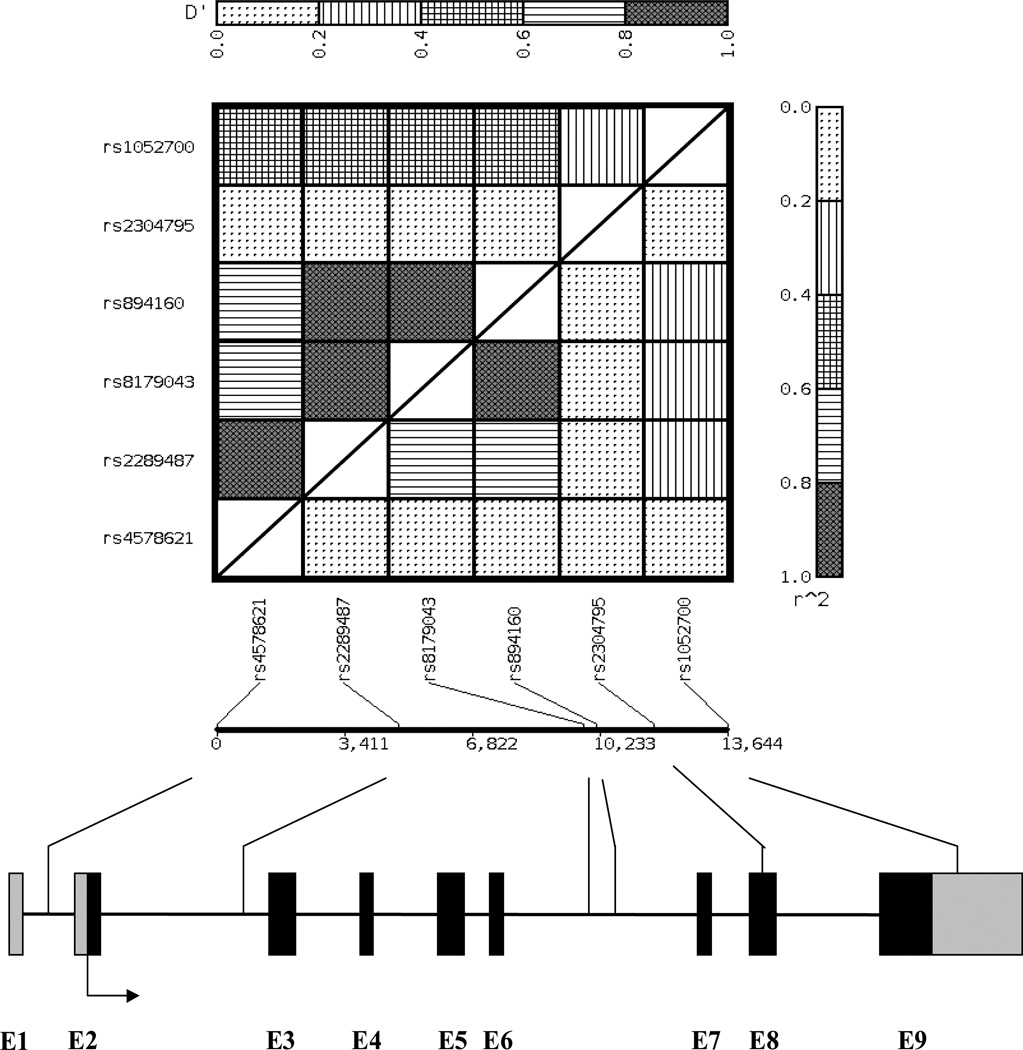
FIGURE 1.
The location of PLIN polymorphisms (not drawn to scale) and pairwise linkage disequilibrium matrix (D’ is presented above the diagonal and r2 is presented below the diagonal). The exons of PLIN gene are depicted by black boxes and the promoter and 3’ UTR are denoted by smaller gray boxes. The direction of transcription is labeled with arrows. The position and identity of polymorphisms are indicated with lines.

