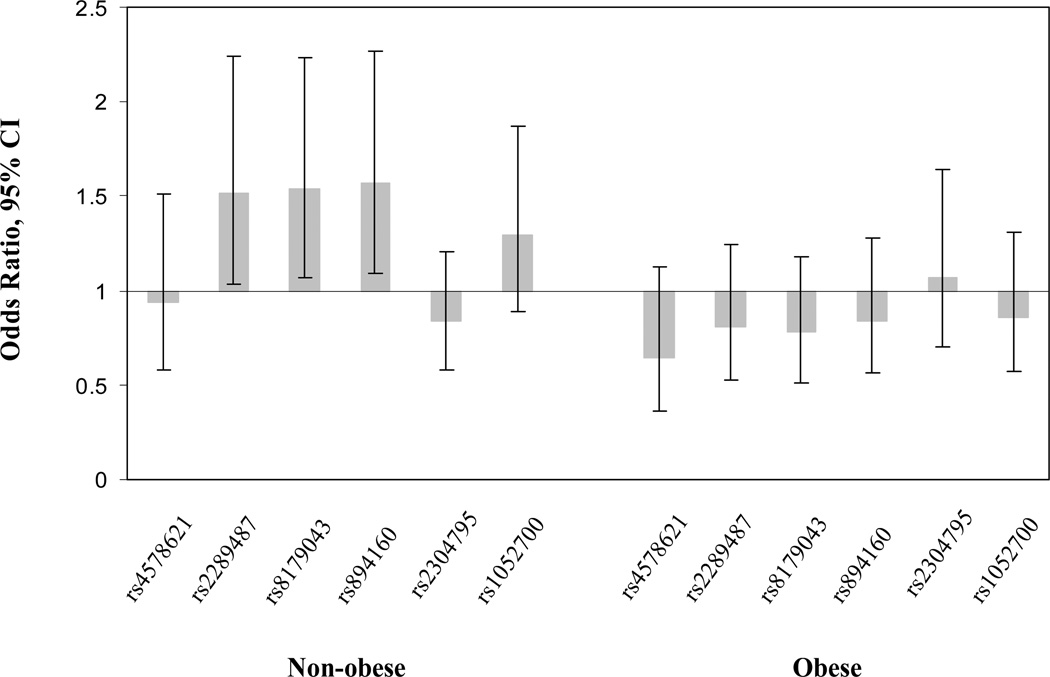
FIGURE 2.
The adjusted associations of PLIN variations (carriers v.s non-carriers) with the risk of type 2 diabetes by central obesity. The Odds ratio and 95% confidence intervals (CI) are presented. Analyses were adjusted for age, BMI, smoking, alcohol consumption, physical activity, family history of diabetes, and menopausal status.

