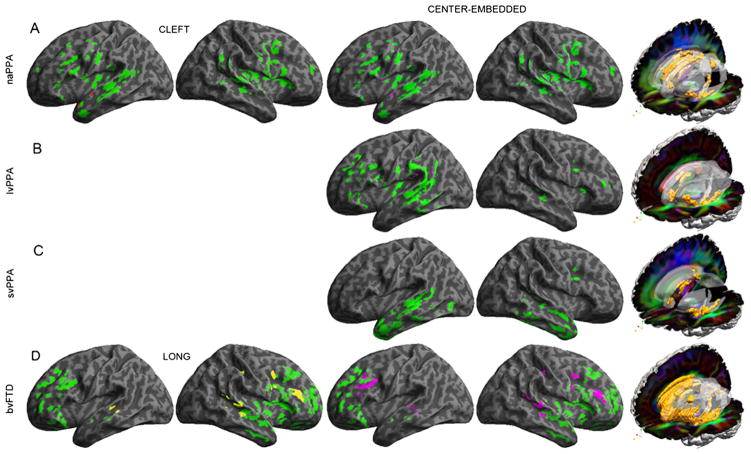
Figure 3.
Grey matter atrophy and regressions relating behaviour to atrophy, and reduced white matter fractional anisotropy. Note: (1) Images on the left illustrate whole brain renderings of grey matter atrophy, and coloured areas show the specific anatomic distribution of significant atrophy compared to matched controls. Anatomic locations of the corresponding clusters are provided in online supplementary appendix 2. Areas in colours other than green illustrate loci of significant regressions relating performance to grey matter atrophy. Images on the right illustrate reduced fractional anisotropy on red-green-blue (RGB) diffusion tensor images (diffusion orientation: red=left-right, green=anterior-posterior, blue=superior-inferior). Ghost areas indicate anatomic regions and orange areas within these ghosts indicate areas of significantly reduced fractional anisotropy compared to matched controls. Anatomic locations of the corresponding clusters are provided in online supplementary appendix 2. (A): non-fluent/agrammatic primary progressive aphasia; (B): logopenic variant primary progressive aphasia; (C): semantic variant primary progressive aphasia; (D): behavioural variant frontotemporal degeneration.

